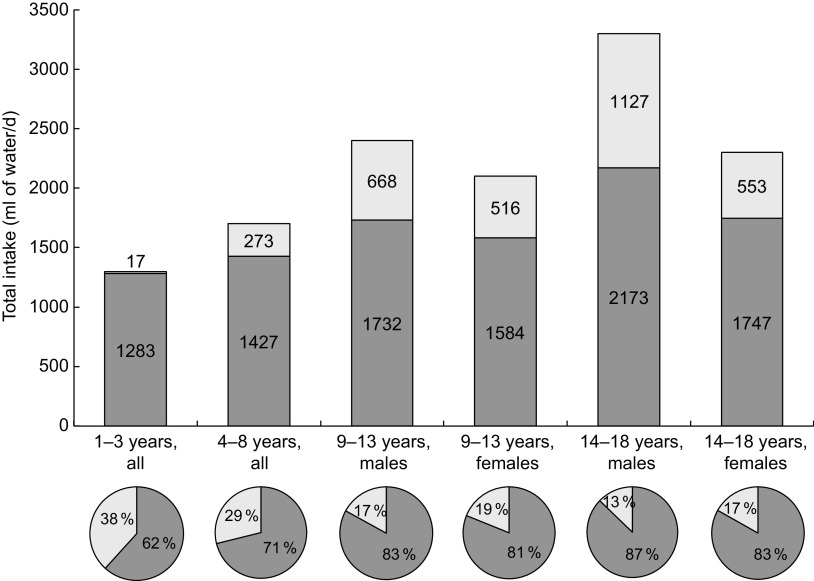
Fig. 2.
Total daily water intake from all sources ( , consumed) by age group and gender in relation to the US Institute of Medicine recommendations (
 , shortfall); children and adolescents aged 1–18 years (n 6867), Mexican National Health and Nutrition Survey, 2012. The proportion of children who do (
 ) or do not meet (
 ) Institute of Medicine Dietary Reference Intakes is shown in the corresponding pie chart

