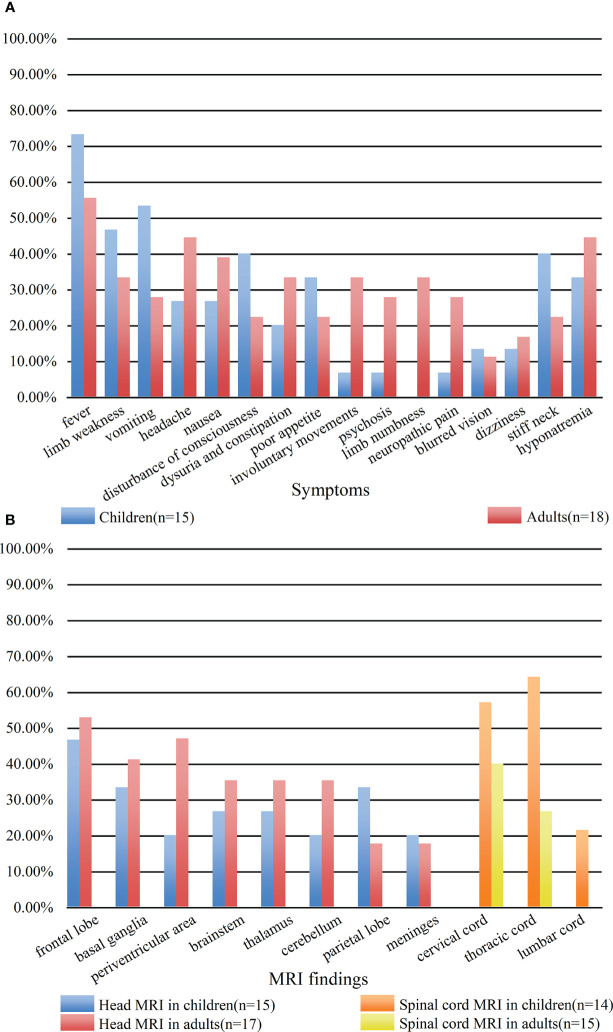
Figure 2.
Comparison of clinical symptoms (A) and MRI findings (B) between children and adults. (A) The blue bar represented the clinical symptoms of children. The red bar represented the clinical symptoms of adults. (B) The blue bar represented the head MRI findings of children. The red bar represented the head MRI findings of adults. The orange bar represented the spinal MRI findings of children. The yellow bar represented the spinal MRI findings of adults.

