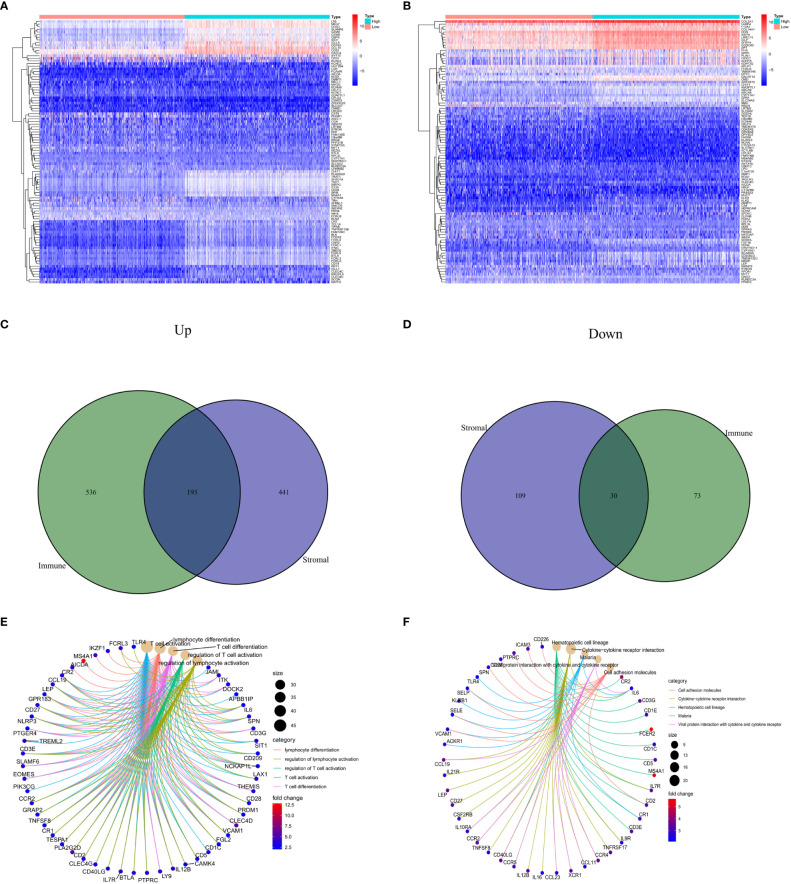
Figure 1.
Comparison of stromal and immune scores in BC patients. (A, B) Heatmaps show the top 50 increases and downwards in immune scores and stromal scores. DEGs are tested using Wilcoxon rank and testing (P<0.05 |log2FC|<1). (C, D) Venn chart analysis of DEGs based on immune scores and stromalscores. (E, F) Analysis of biological functions and pathways associated with degs in BC, pValue <0.05 was considered significantly. BC: Breast cancer; DEGs: Different express genes.

