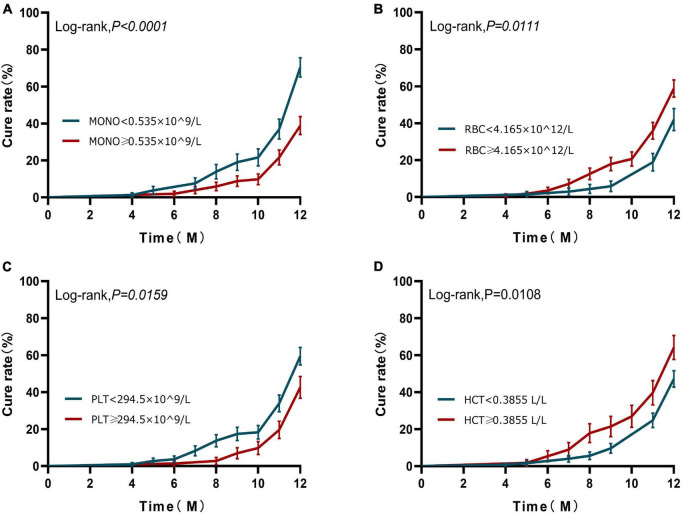
FIGURE 3.
Kaplan–Meier curves of 12-month prognosis. (A) Analysis of cure status grouped according to monocyte at diagnosis during 12-month follow-up. (B) Analysis of cure status grouped according to RBC at diagnosis during 12-month follow-up. (C) Analysis of cure status grouped according to platelets at diagnosis during 12-month follow-up. (D) Analysis of cure status grouped according to HCT at diagnosis during 12-month follow-up. MONO, monocyte; RBC, red blood cell; PLT, platelets; HCT, hematocrit.

