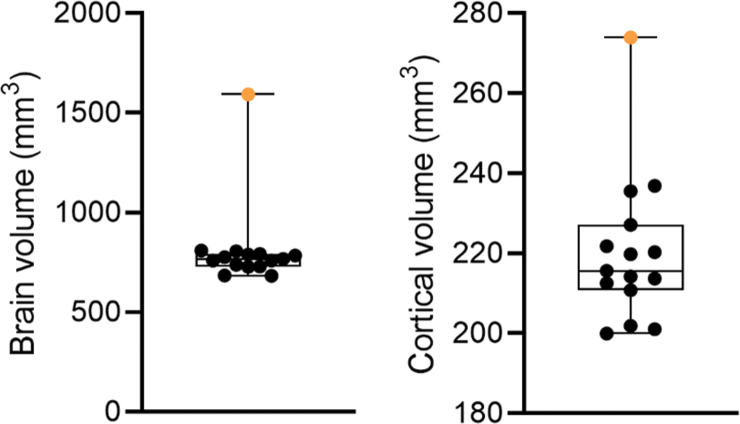
FIG. 7.
Brain and cortical volumes. The graph shows the total brain volume and cortical volume (mm3) of rat #112 (orange filled circle) and the remaining 14 TBI-induced rats in the cohort. The brain volume of rat #112 was 210% of the cohort mean. The cortical volume of rat #112 was 127% of the cohort mean. Data are presented as whisker plots from minimum to maximum. TBI, traumatic brain injury.

