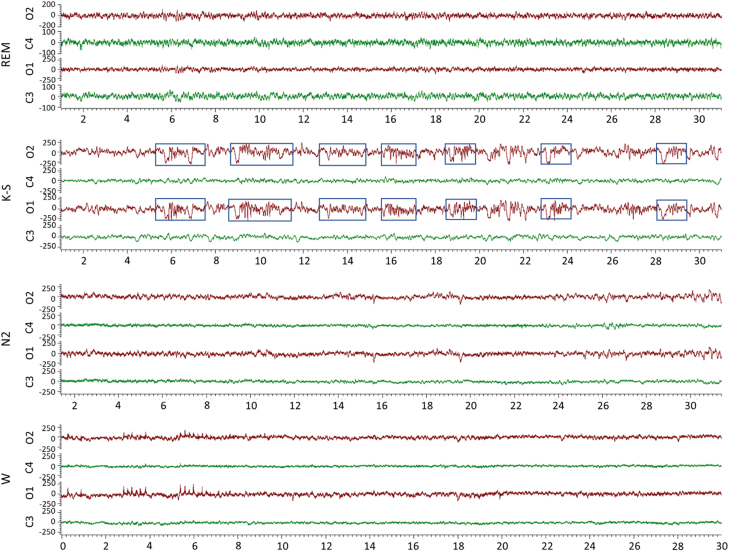
FIG. 9.
Sleep patterns. EEG (low-frequency filter, 0.5 Hz; high-frequency filter, 100 Hz) showing 30-sec epochs (x-axis) of the typical sleep EEG patterns in rat #112. Note the different y-axis scale in the REM-panel and the occurrence of symmetric bilateral K-spindle complexes (marked with blue boxes) in the K-spindle-panel. C1, ipsilateral frontal; C2, contralateral frontal; EEG, electroencephalography; K-S, K-spindle; N2, N2 sleep; N3, N3 sleep; O1, ipsilateral occipital; O2, contralateral occipital; REM, rapid eye movement; s, second; TBI, traumatic brain injury; W, wake.

