
Fig. 1.
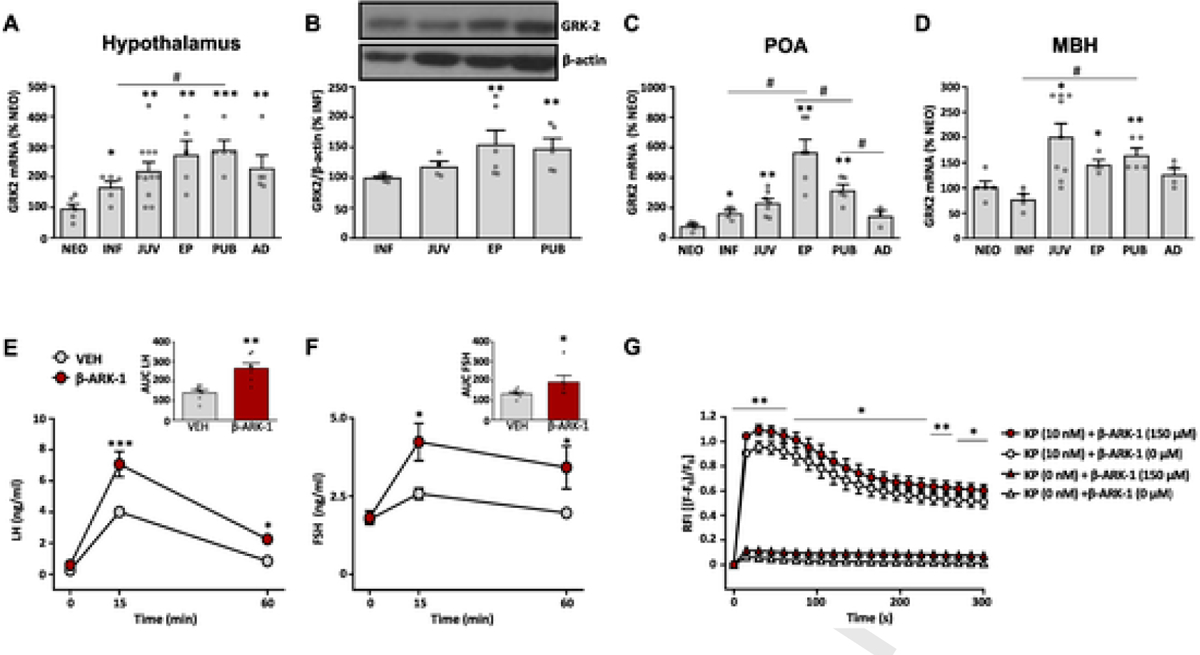
GRK2 expression in rat hypothalamus and GRK2 modulation of kisspeptin signaling. GRK2 mRNA expression (A) and protein content (B) in whole hypothalamic samples from female rats at different stages of postnatal development. Data on GRK2 mRNA expression in the preoptic area (POA; panel C) and the medio-basal hypothalamus (MBH; panel D) of female rats at different stages of postnatal development are also shown. For presentation of data, the level of expression of GRK2 mRNA in neonatal samples (NEO), or protein content in infantile samples (INF), were taken as 100%, and the other values were normalized accordingly. Data represent mean ± SEM. Group sizes are: N = 6 for NEO, INF and EP stage, n = 11 for JUV stage and n = 5 for AD stage in figs. A-D. *P < 0.05, **P < 0.01, ***P < 0.001 vs reference (NEO or INF) values; # P < 0.05, ## P < 0.01 vs the indicated paired groups (denoted by the continuous overline). Statistically significant differences were assessed by ANOVA followed by Student–Newman–Keuls multiple range tests. NEO: neonatal; INF: infantile; JUV: juvenile; EP: early-pubertal; PUB: pubertal; AD: adult. In addition, in the lower panels, functional analyses of the impact of blockade of GRK2 on kisspeptin signaling in vivo are presented. LH (E) and FSH (F) responses to icv administration of Kp-10 in female rats (N = 7/group), pretreated with the GRK2-inhibitor, βARK1-I, or vehicle, are presented. In addition to time-course profiles, integral (AUC) secretory responses are shown in the insets. Finally, in G, we show data on calcium mobilization responses to Kp-10 stimulation in a cell line stably expressing the human kisspeptin receptor (HEK293T-GPR54), pretreated with βARK1-I or vehicle. Data represent mean ± SEM of three independent experiments. Statistical significance of the differences was assessed by ANOVA followed by Student–Newman–Keuls multiple range tests (time-course hormonal data) or paired Student t-test (AUC and in vitro data). *P < 0.05, **P < 0.01, ***P < 0.001 vs. corresponding vehicle-treated groups. RFI = relative fluorescence intensity.