Figure 2.

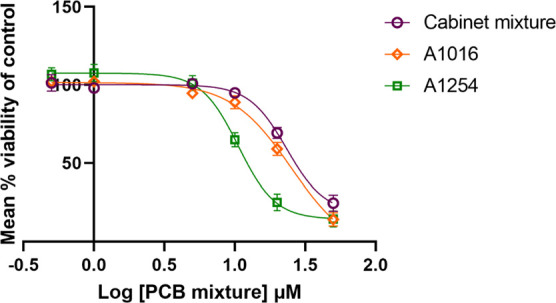
Concentration–response curves of three PCB mixtures analyzed for toxicity in C6 cells after a 24 h exposure. Data is normalized to DMSO control and is based on at least n = 3.

Concentration–response curves of three PCB mixtures analyzed for toxicity in C6 cells after a 24 h exposure. Data is normalized to DMSO control and is based on at least n = 3.