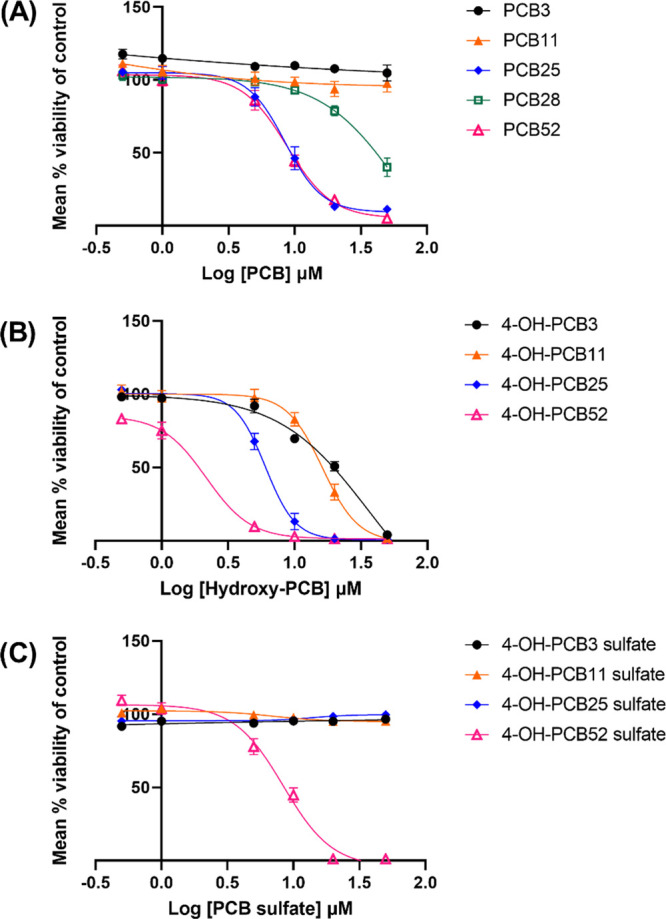
Figure 3.

Concentration–response curves of (A) parent LC-PCBs and their (B, C) human-relevant metabolites in C6 cells. A concentration range of 0.5 to 50 μM was used for each compound and cell viability assessed using the MTT assay. Data were obtained from at least three biological replicates with each containing three technical replicates and were normalized to DMSO control. They are represented as mean percent cell viability ± SEM against Log10 PCB or PCB-metabolite concentration.
