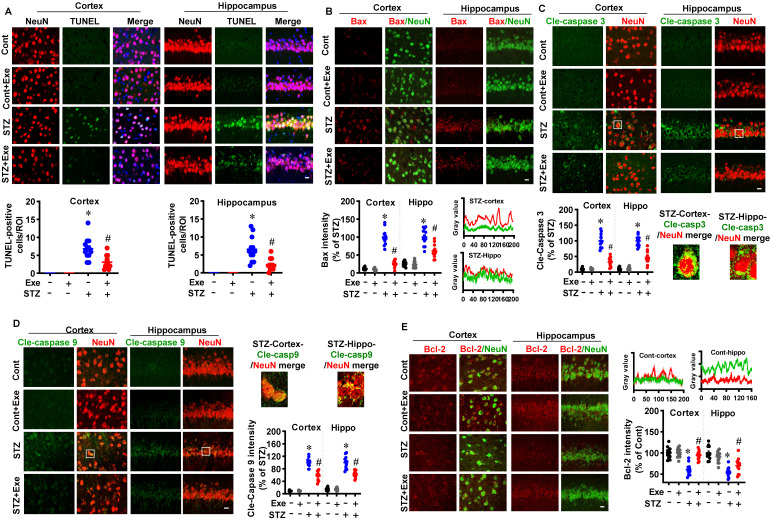
Figure 3.
HIIT reduces neuronal apoptosis following STZ administration. (A) Representative immunofluorescence images of NeuN (red) and TUNEL staining (green). White arrows indicate TUNEL+ neurons. TUNEL-positive cells were counted and analyzed in the cortex and hippocampus. (B) Representative confocal images showed NeuN (green) and Bax (red) fluorescent signals in the cortex and hippocampus. Bax intensity was analyzed and shown as a percentage of control. Line-scan analysis of representative images was conducted to analyze the colocalization of Bax and NeuN signals. (C) Representative confocal images of Cle-caspase 3 (Green) and NeuN (Red). The white square marked an enlarged view of the area. Cle-Caspase 3 intensity was analyzed as a percentage of STZ. (D) Representative confocal images of Cle-caspase 9 (Green) and NeuN (Red). An enlarged view of the area was marked by the white square. Cle-Caspase 9 intensity was analyzed as a percentage of STZ. (E) Representative confocal images showed NeuN (green) and Bax (red) fluorescent signals in the cortex and hippocampus. Bax intensity was analyzed and shown as a percentage of control. Line-scan analysis of representative images was conducted to analyze the colocalization of Bax and NeuN signals. The scale bar represents 10 μm. Data represent mean ± SEM, n = 12 slices from 6 animals. *P < 0.05 vs. Cont group, #P < 0.05 vs. STZ group.

