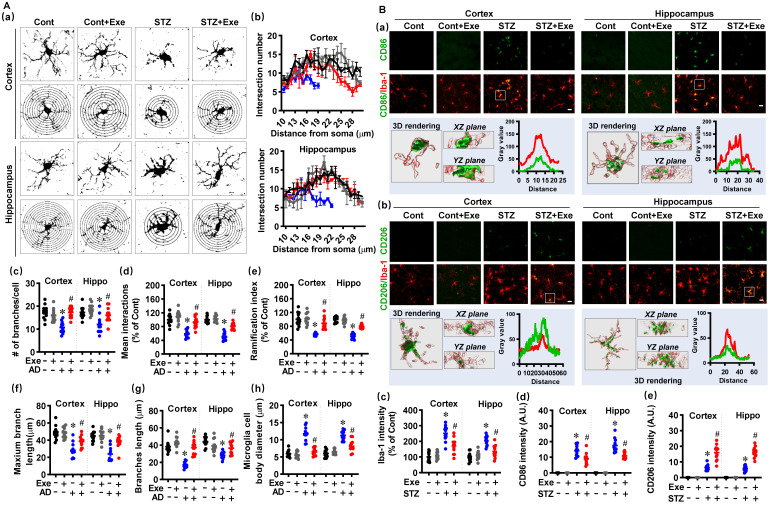
Figure 5.
HIIT reduces the over-activation of microglia and induces microglia polarization toward the M2 phenotype. (A) Representative images of Iba1+ microglia and the Sholl analysis (a). The intersection number per radius over the distance from the cell body was displayed graphically in the curve. (b). The number of branches (c), mean interactions (d), ramification index (e), maximum branch length (f), average branch length (g), and cell body diameter (h) was analyzed. (B) Representative confocal microscopy shows co-staining of CD86 (green, M1 marker) and Iba-1 (red). 3D reconstruction and line-scan analysis of the representative cells (white square) in the STZ group were conducted (a). Representative confocal microscopy shows co-staining of CD206 (green) and Iba-1 (red). 3D reconstruction and line-scan analysis of the representative cells (white square) were conducted (b). Iba-1 (c), CD86 (d), and CD206 intensities were analyzed. The scale bar represents 10 μm. Data represent mean ± SEM, n = 12 slices from 6 animals. *P < 0.05 vs. Cont group, #P < 0.05 vs. STZ group.

