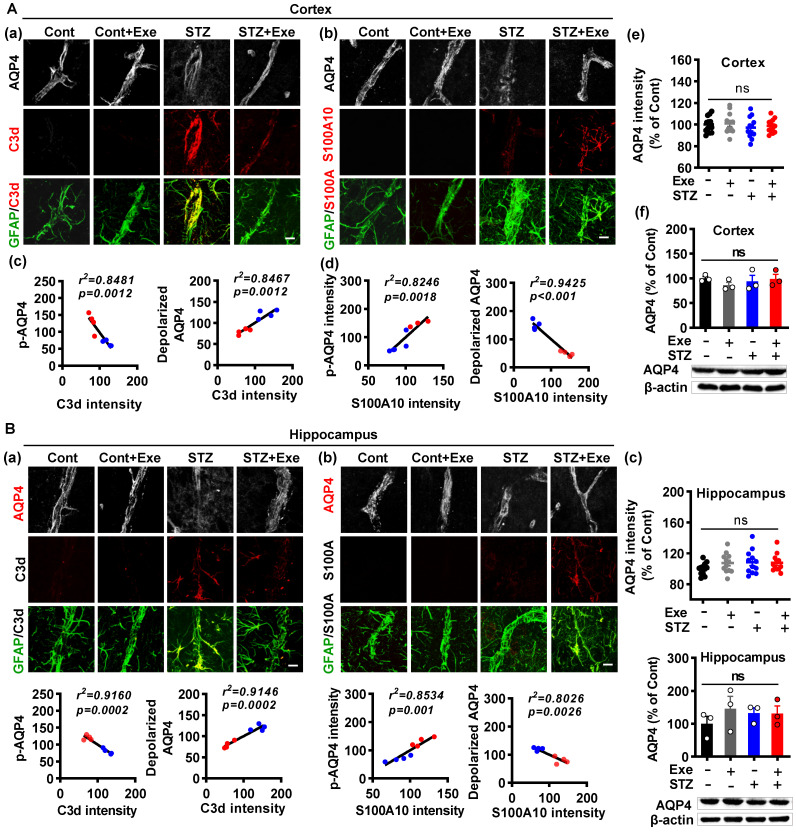
Figure 8.
HIIT-induced AQP4 polarized distribution correlates closely with astrocyte phenotype without affecting AQP4 expression. (A) Representative immunofluorescence images of AQP4 (white), C3d (red), and GFAP (green) in the cortex (a). Representative immunofluorescence images of AQP4 (white), S100A10 (red), and GFAP (green) in the cortex (b). Linear regression analysis of the association between AQP4 (p-AQP4 or depolarized AQP4) and C3d (c) or S100A10 (d). The levels of AQP4 in the cortex were measured by quantitative analysis of AQP4 immunofluorescence intensity (e, n = 12 slices from 6 animals) and western blot (f, n = 3). Data represent mean ± SEM. The scale bar represents 10 μm. (B) Representative immunofluorescence images of AQP4 (white), C3d (red), and GFAP (green) in the hippocampus (a). Representative immunofluorescence images of AQP4 (white), S100A10 (red), and GFAP (green) in the hippocampus (b). Linear regression analysis of the association between AQP4 (p-AQP4 or depolarized AQP4) and C3d (c) or S100A10 (d). The levels of AQP4 in the hippocampus were measured by quantitative analysis of AQP4 immunofluorescence intensity (e, n = 12 slices from 6 animals) and western blot (f, n = 3). Data represent mean ± SEM. The scale bar represents 10 μm. *P < 0.05 vs. Cont group, #P < 0.05 vs. STZ group.

