Figure 9.
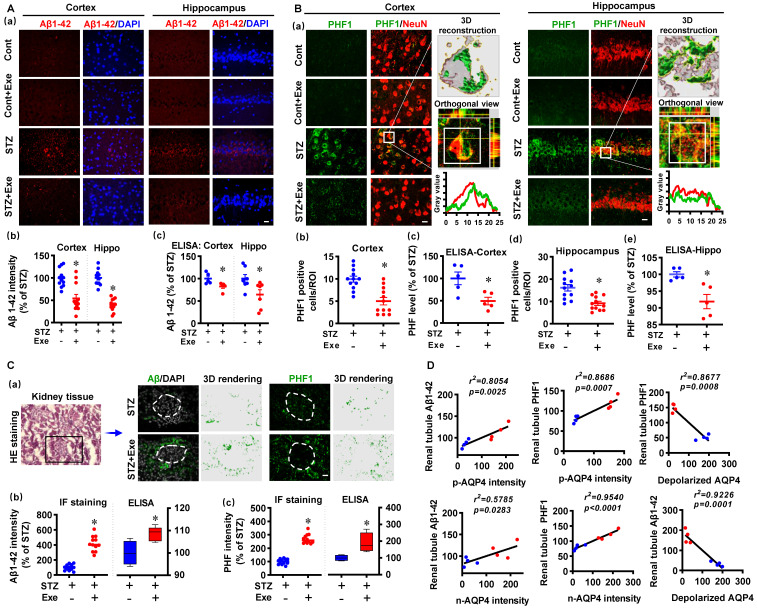
HIIT attenuates amyloid load and abnormal tau hyperphosphorylation through kidney-mediated clearance and polarized AQP4. (A) Representative immunofluorescence images of Aβ1-42 (red) and DAPI (blue) in the cortex and hippocampus (a). The Aβ1-42 intensities in the cortex and hippocampus were quantified and analyzed (b, n = 12 slices from 6 animals). The scale bar represents 10 μm. The levels of Aβ1-42 in the cortex and hippocampus were measured by ELISA (c, n = 5). The Aβ1-42 intensity was presented as a percentage of the STZ group. (B) Representative immunofluorescence images of PHF1 (green) and NeuN (red) in the cortex and hippocampus (a). 3D reconstruction of the neuron (white square), orthogonal view, and line-scan analysis in the STZ group were conducted to confirm the colocalization of PHF1 and NeuN (a). Numbers of PHF1 positive cells in the region of interest (b and d, n =12 slices from 6 animals). The PHF level in the cortex and hippocampus were measured by ELISA (c and e, n = 5). (C) Representative immunofluorescence and 3D rendering images of Aβ1-42 and PHF1 in the kidney tissue (a). The images of HE staining showed the glomerulus and kidney tubule marked by a box where the immunofluorescence images were taken (a). Immunofluorescence intensity and ELISA analysis results of Aβ1-42 (b) and PHF (c) were displayed as a percentage of the STZ group. (D) Linear regression analysis of the association between AQP4 (n-AQP4, p-AQP4, and depolarized AQP4) and the levels of Aβ or PHF1 in the renal tubule. P < 0.05 vs. STZ group.

