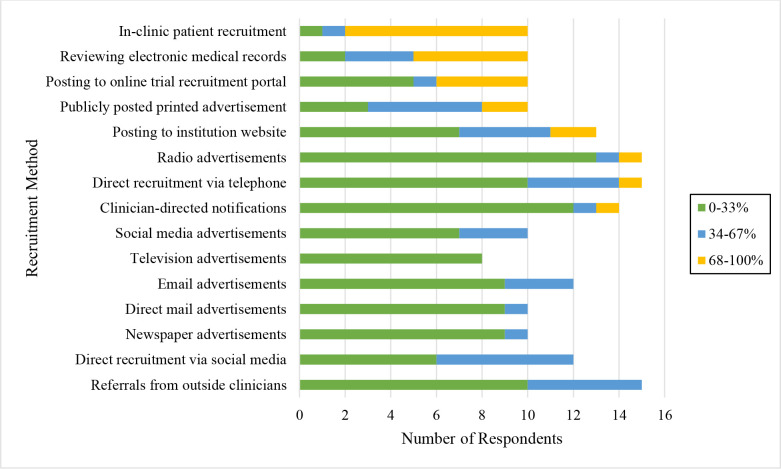
Figure 1.
Frequency of Recruitment Method Usage. Colors correspond to the percentage of trials that use a given recruitment method (colors in legend). The x-axis notes the number of respondents who report the frequency of each recruitment method. Names of recruitment methods are listed on the y-axis.

