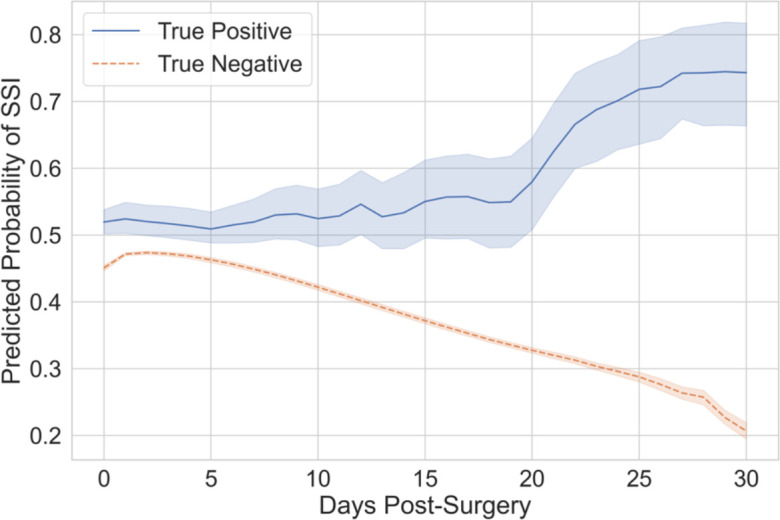
Figure 4.

Average predicted probabilities per day for operative events correctly classified by the model. Mean with shaded 95% confidence intervals. The solid blue line represents the true positive cases while the dashed orange line represents the true negative controls.
