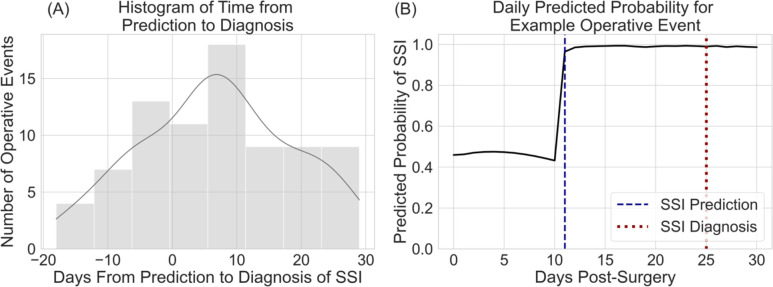
Figure 5.
(A) displays the histogram of days from prediction to diagnosis of SSI. A positive number of days indicates the model predicted SSI prior to diagnosis. (B) displays the daily predicted probabilities for an operative event in which SSI developed. The dashed blue line represents the day the model predicted SSI. The dotted red line represents the day SSI was diagnosed.

