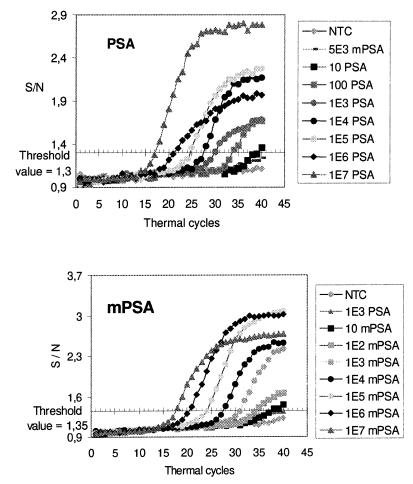
Figure 3.
Real time monitoring of PSA and mPSA amplifications. The reactions contained either a PSA- or a mPSA-specific terbium-labeled probe and 0–107 molecules of the respective target. Terbium fluorescence rises above background when the amount of synthesized target exceeds the detection limit of the assay. The position of the x-axis shows the threshold value of each assay (1.3 in the PSA and 1.35 in the mPSA assay).

