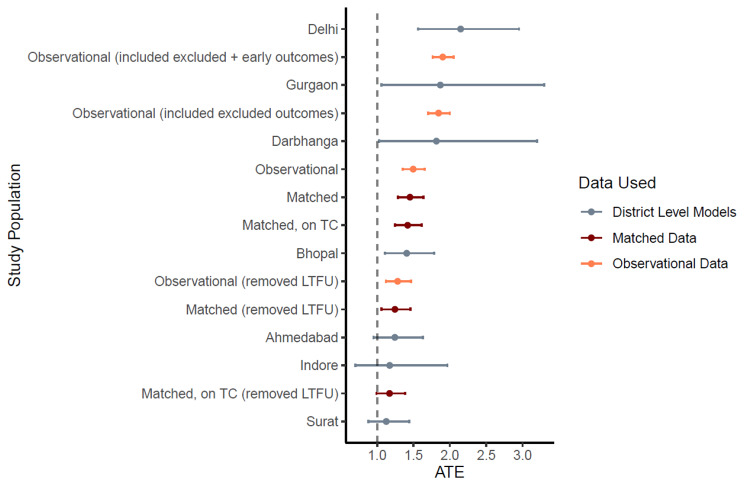
Fig. 7.
Forest plot; sensitivity analysis
Note: 1) OR Ratios are displayed along with 95% C.I.; 2) Dotted line at X = 1 illustrates the sub-populations which reveal a significant impact of free drug provision on treatment outcomes (to the right) or not (to the left) 3) LTFU refers to lost to follow-up; 4) All district wise models are fitted on the matched dataset; 5) Matched on TC refers to a matched dataset which was created by matching on treatment coordinator, and not on district. This alternative matching specification ensures an equal share of patients receiving free drugs and not receiving free drugs and results in 19,436 observations or 9718 matching pairs; 5) Excluded outcomes refer to “not evaluated”, and “pending” outcomes, which were excluded in the base analysis – These were considered as unsuccessful for this sensitivity analyses; 6) Early outcomes refer to outcomes which were declared within 30 days of diagnosing date, and were excluded from the base analysis 7) Patient groups, pre- and post-lockdown, refer to patients who had their treatment outcomes declared before and after 25th March 2020, respectively.

