Fig. 6.
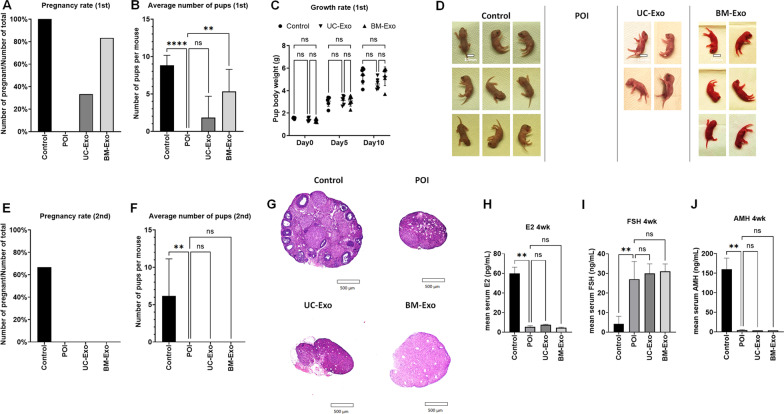
Fertility restoration in the POI mouse model after exosome treatment. A Pregnancy rate in the healthy control (control), untreated POI (POI), umbilical-derived MSC exosome treatment (UC-Exo), and bone marrow-derived MSC-derived exosome treatment (BM-Exo) groups in the first breeding. B Average number of pups per litter between the control, POI, UC-Exo, and BM-Exo groups in the first breeding. C Postnatal growth rate comparison between the control, UC-Exo, and BM-Exo groups. D Representative image of delivered pups on Day 0. E Pregnancy rate of the control, POI, UC-Exo, and BM-Exo groups in the second breeding. F Average number of pups per litter between the control, POI, UC-Exo, and BM-Exo groups in the second breeding. G Ovarian tissue morphology after the second breeding. H–J Serum hormone levels after the second breeding. Data are presented as the mean ± SD. (n = 3, significance level, *p < 0.05, **p < 0.005, ***p < 0.0005, ****p < 0.0001; NS: not significant.)

