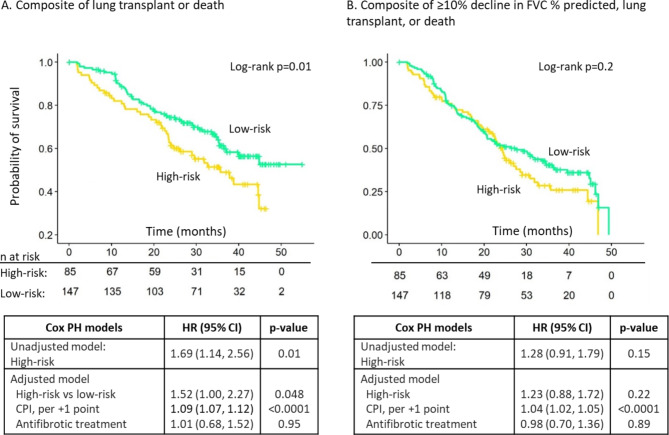
Fig. 2.
Risk of outcomes based on the 52-gene signature. Kaplan-Meier plots show the time from enrollment to the composite outcome of lung transplant or death (A) and the composite outcome of ≥ 10% absolute decline in FVC % predicted, lung transplant, or death (B) for the high-risk group and low-risk group. The associated tables show the unadjusted hazard ratio and the hazard ratio adjusted for CPI and antifibrotic treatment use for the high-risk group compared to the low-risk group. HR: hazard ratio; PH: proportional hazards; CPI: composite physiologic index

