Fig. 2.
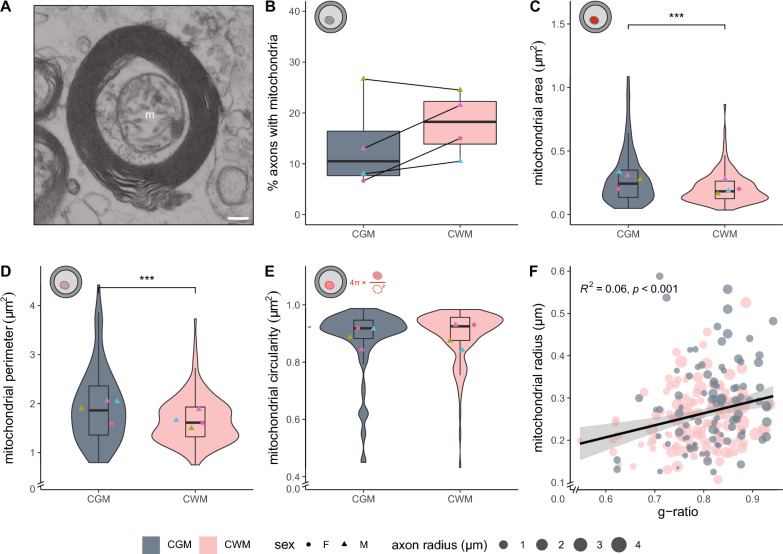
Mitochondrial size in myelinated axons correlates with g-ratio in control brain tissue. A Cross-sectional image of a myelinated axon with a mitochondrion (m) in post-mortem brain tissue of control donors. Scale bar represents 0.2 µm. B Mean percentage myelinated axons with mitochondria in post-mortem control grey matter (CGM) and control white matter (CWM) tissue of control donors. C–E Analysis of cross-sectional axonal mitochondrial area (C), perimeter (D), and circularity (E). Icons indicate measured mitochondrial characteristic (red), violin plots depict the data distribution of all measurements, datapoints represent mean per donor (● = female, ▲ = male, color-coded, see Table 1), and boxplots show the median and inter quartile range (IQR). F Scatter plot showing the correlation between mitochondria radius and g-ratio. The size of the datapoints indicates axon radius in µm. The number of control (CGM/CWM) donors is 4 (paired) and 10–49 mitochondria per donor were analysed (dependent on the number of mitochondria in the 100–200 myelinated axons that were measured in Fig. 1). Statistics were performed using a paired Student’s t test (B), linear mixed model (C–E), or a Pearson’s r test (F) (***p < 0.001)

