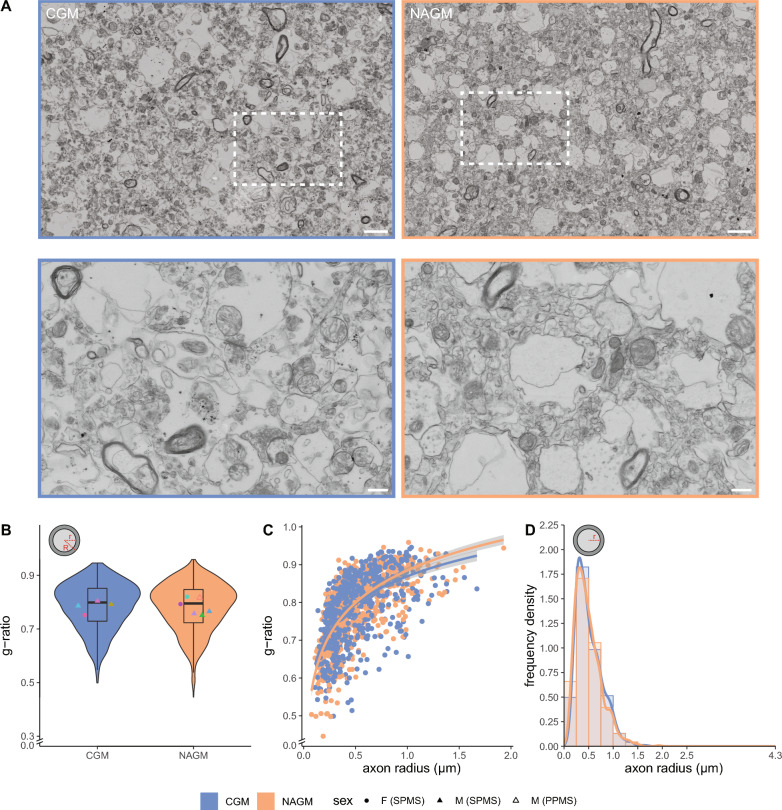
Fig. 3.
Myelinated axons in CGM and NAGM have a similar g-ratio and axon size distribution. A Representative scanning electron microscopic images (STEM) images of post-mortem control grey matter (CGM) of control donors (from donor CM 2) and normal appearing grey matter (NAGM) of donors with progressive MS (from donor NAM 6). Top: overview images. Bottom: detailed images from boxed regions in top images. Scale bars represent 2 µm (top images) or 0.5 µm (bottom images). B Violin plots depict the distribution of g-ratio (r/R). Datapoints represent mean per donor (● = female (SPMS), ▲ = male (SPMS), △ = male (PPMS), color-coded, see Table 1) and boxplots show the median and inter quartile range (IQR). C Scatter plot showing the g-ratio versus axon radius (log-linear fit). D Histogram with kernel density estimation of the axon radius (r). Number of control donors (CWM) is 4, number of donors with progressive MS (NAWM) is 6, and 100–200 myelinated axons per donor were analysed. Statistics were performed using a linear mixed model (B) or unpaired Student’s t test (D)

