Fig. 5.
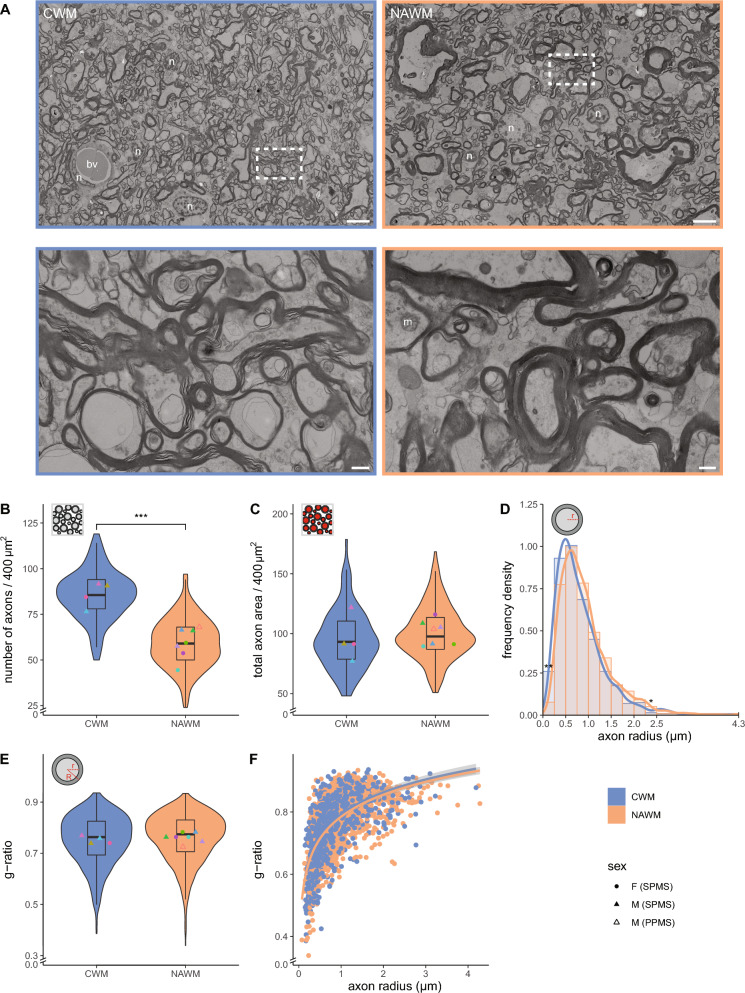
Reduced myelinated axon density in NAWM, while total myelinated axon area and g-ratio are unaffected. A Representative scanning transmission electron microscopic images (STEM) images of post-mortem control white matter (CGM) of control donors (from donor CM 1) normal appearing white matter (NAWM) of donors with progressive MS (from donor NAM 6). Top: overview images. Bottom: detailed images from boxed regions in top images. n = nucleus, bv = blood vessel, m = mitochondria. Scale bars represent 5 µm (top images) or 0.5 µm (bottom images). B, C Violin plots depict the number of myelinated axons (B) and their total area (C, red) in an area of 20 × 20 µm. D Histogram with kernel density estimation of the axon radius (r). E Violin plot depicts the distribution of g-ratio (r/R). Datapoints represent mean per donor (B, C, E ● = female (SPMS), ▲ = male (SPMS), △ = male (PPMS), color-coded, see Table 1) and boxplots show the median and inter quartile range (IQR). F Scatter plot showing the g-ratio versus axon radius (log-linear fit). Number of control donors (CWM) is 4, number of donors with progressive MS (NAWM) is 7, 200 myelinated axons per donor (D–F), and 25 areas of 20 × 20 µm (B, C) were analysed. Statistics were performed using an unpaired Student’s t test (D), or a linear mixed model (B, C, E) (*p < 0.05; **p < 0.01; ***p < 0.001)

