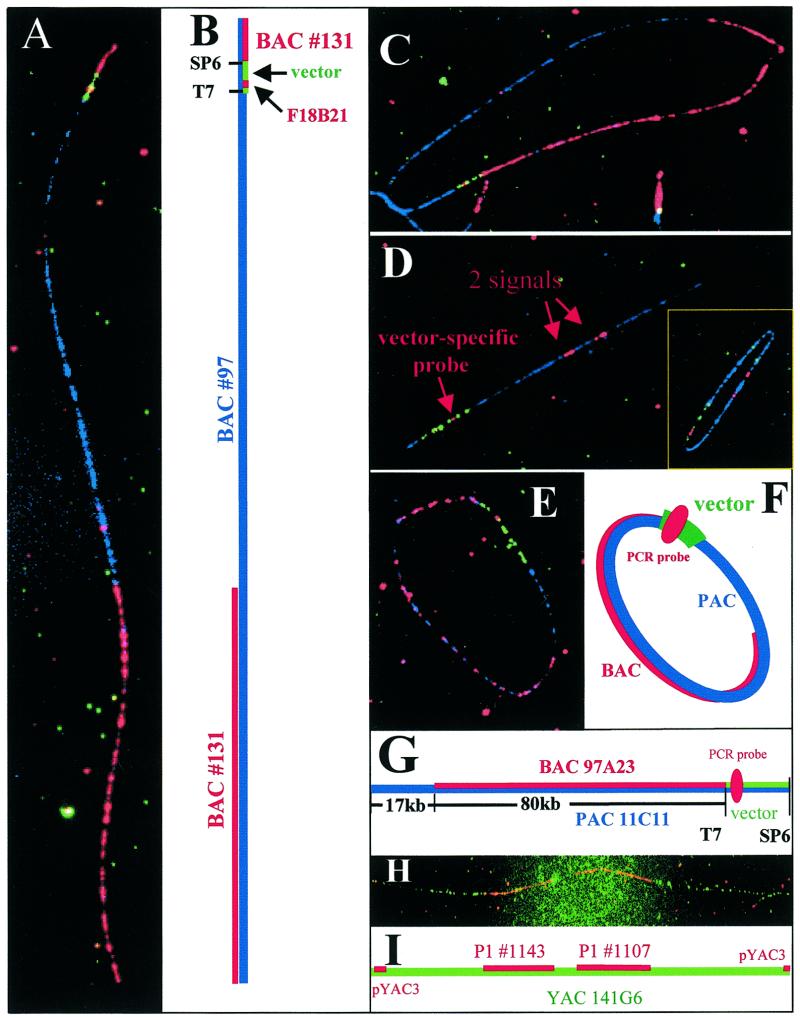
Figure 1.
(A–C) BAC clone #131 mapped to BAC clone #97. (A) A linear DNA fiber of BAC #97 fiber (blue), BAC #131 hybridization domain (red) and the PCR-synthesized vector-specific probes hybridization signals (green/red). (B) A schematic illustration of the different hybridization domains for the linear BAC molecule. (C) A circular molecule from the same hybridization mixture with all the hybridization domains as explained in (B). (D) A plasmid clone hybridized to a P1 clone (#41, blue). The hybridization shows two domains (red) indicating chimerism of the clone. The vector-specific probes (green/red) appeared on the lower left corner of the picture. (Insert) A comparison of hybridization signals recorded from either randomly broken linear or circular DNA molecules. (E–G) Mapping of a BAC clone 97A23 onto a PAC clone 11C11. (E) A circular PAC clone 11C11 DNA fiber (blue) was hybridized with BAC clone 97A23 (red) and PAC vector-specific probes (green/red). (F) A schematic drawing of each hybridization domain and the extent of overlap. (G) A schematic of hybridization domains. The PCR synthesized vector-specific probe (red) is located near the T7 end of the vector pAd10SacBII (green). (H–I) Hybridization of two P1 clones #1107 and #1143 onto YAC clone 141G6. (H) Probes of two P1 clones #1107 and #1143 (red) and the pYAC3 vector (red) were hybridized onto a YAC clone 141G6 DNA fiber (green). The hybridization of the vector probe pYAC3 (red dots at both ends) indicates a complete YAC DNA fiber. (I) A schematic drawing showing the extent of the hybridization domains and the pYAC3 vector probe signals (red) on both ends.

