
Figure 3.
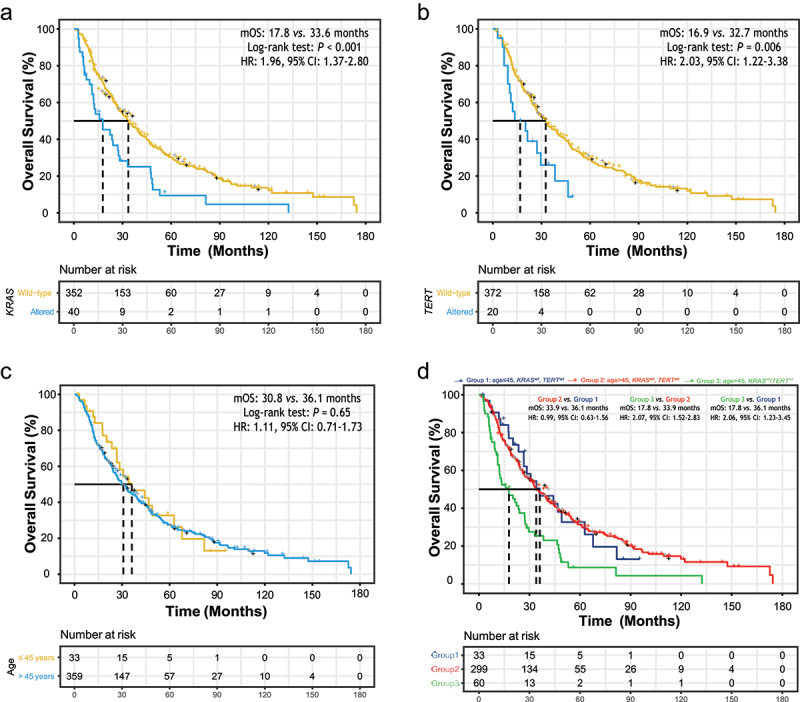
The association of overall survival (OS) with baseline clinical and genetic characteristics.
(a) Altered KRAS gene was associated with inferior OS. Median OS (mOS): 17.8 vs. 33.6 months, hazard ratio (HR): 1.96, 95% confidence interval (CI): 1.37–2.80. (b) Altered TERT gene was associated with inferior OS. mOS: 16.9 vs. 32.7 months, HR: 2.03, 95% CI: 1.22–3.38. (c) Older patient age was not significantly associated with OS. mOS: 30.8 vs. 36.1 months, HR: 1.11, 95% CI: 0.71–1.73. (d) Old patients without altered KRAS or TERT mutations had similar OS in comparison with young patients without KRAS or TERT mutations, while old patients harboring KRAS or TERT alterations had inferior OS (mOS: 17.8 vs. 33.9 months, HR: 2.07, 95% CI: 1.52–2.83; mOS: 17.8 vs. 36.1 months, HR: 2.06, 95% CI: 1.23–3.45).