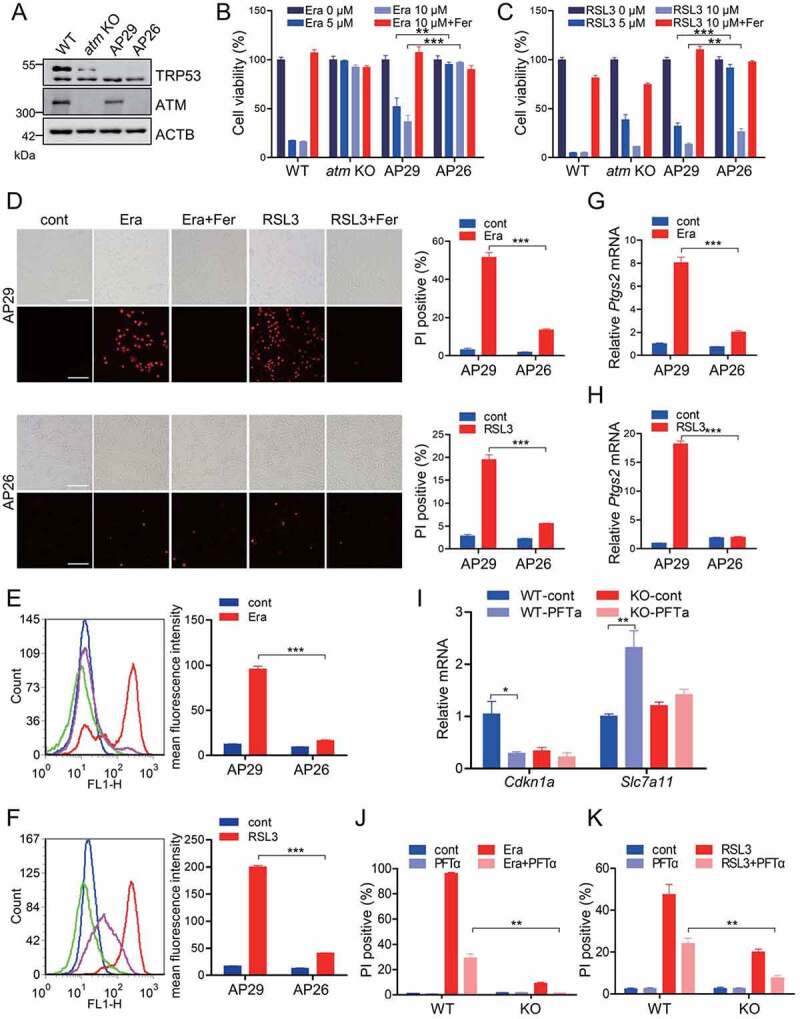
Figure 2.

ATM determines ferroptotic cell death independent of TRP53. (A) Western blot for the WT, atm KO, AP29 (trp53 KO) and AP26 (atm trp53 double KO) MEF cells. (B, C) WT, atm KO, AP29 and AP26 MEF cells were treated with the indicated dose of erastin (B) or RSL3 (C) with or without 10 μM Fer. The relative cell viability was analyzed with CCK8 assay. (D-H) AP29 and AP26 cells were treated with 5 μM erastin or 1 μM RSL3 with or without 10 μM Fer. The cell death was analyzed with PI staining followed by fluorescence imaging and flow cytometry (D). Representative images are presented. Scale bar: 100 μm. The lipid peroxidation was measured by C11 BODIPY 581/591 staining and flow cytometry (E, F). The relative mRNA level of Ptgs2 was analyzed by quantitative RT-PCR (G, H). (I) WT and atm KO MEF cells were treated with TRP53 inhibitor PFTα (25 μM), and the relative mRNA levels of Cdkn1a/p21 and Slc7a11 were analyzed by quantitative RT-PCR. (J, K) WT and atm KO cells were treated with 5 μM erastin (J) or 1 μM RSL3 (K) with or without 25 μM PFTα. The cell death was analyzed with PI staining followed by flow cytometry analysis. Data represent the mean ± SEM from three independent experiments. * P < 0.05, ** P < 0.01, *** P < 0.001 was determined by student’s t-test.
