Figure 3.

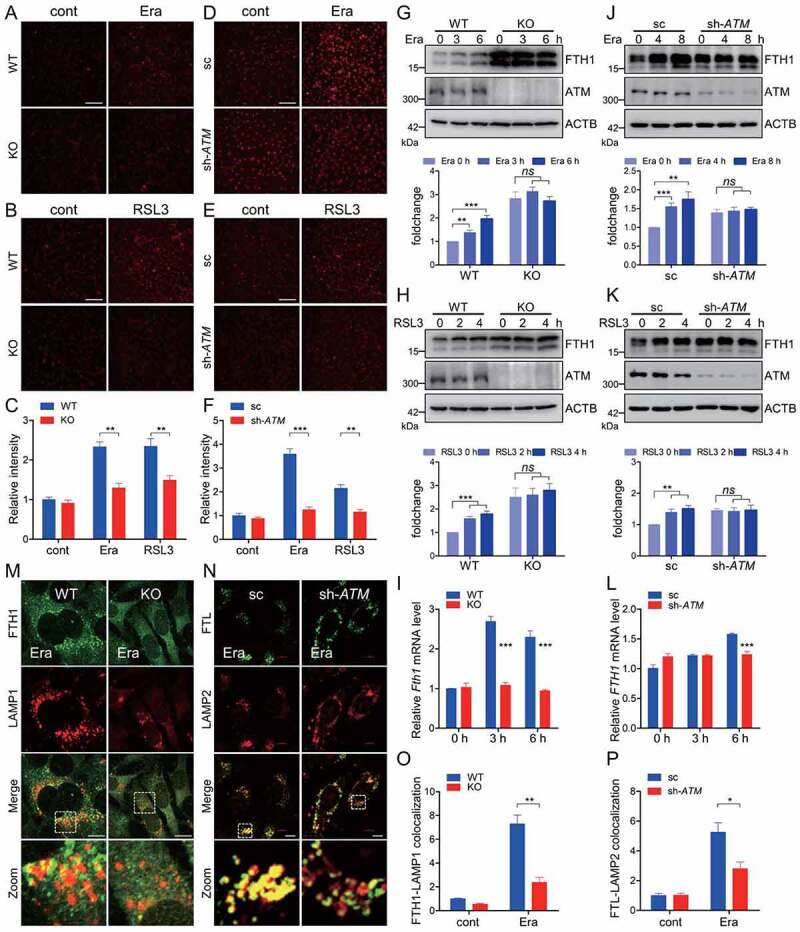
ATM determines ferroptosis-associated ferritinophagy. (A-C) WT and atm KO cells were treated with 2.5 μM erastin (A) or 1 μM RSL3 (B), and the labile free iron was analyzed with FerroOrange staining. Representative images are presented. Scale bar: 200 μm. The relative fluorescence intensity was quantified (C). (D-F) Stable ATM knockdown HT-1080 and the scramble control cells were treated with 5 μM erastin (D) or 2.5 μM RSL3 (E), and the labile free iron was analyzed with FerroOrange staining. Representative images are presented. Scale bar: 200 μm. The relative fluorescence intensity was quantified (F). (G-I) WT and atm KO cells were treated with 2.5 μM erastin (G, I) or 1 μM RSL3 (H) for the indicated time. Cells were then harvested for immunoblotting analysis (G, H) and quantitative RT-PCR (I) to check the FTH1 expression. Quantification of the relative FTH1 protein levels in (G) and (H) is shown in the corresponding below histogram. (J-L) Stable ATM knockdown HT-1080 and the scramble control cells were treated with 5 μM erastin (J, L) or 2.5 μM RSL3 (K) for the indicated time. Cells were then harvested for immunoblotting analysis (J, K) and quantitative RT-PCR (L) to check the FTH1 expression. Quantification of the relative FTH1 protein levels in (J) and (K) is shown in the corresponding below histogram. (M-P) WT and atm KO cells (M, O), as well as sc and ATM knockdown HT-1080 cells (N, P) were treated with erastin. Cells were then fixed, stained by indicated antibodies, and imaged with a confocal microscope. Representative images are presented (M, N). Scale bar: 10 μm. The relative colocalization between ferritin and lysosome was quantified (O, P). Data represent the mean ± SEM from three independent experiments, each with >200 cells counted per condition. * P < 0.05, ** P < 0.01, *** P < 0.001, ns non-significant, was determined by student’s t-test.
