Figure 1.

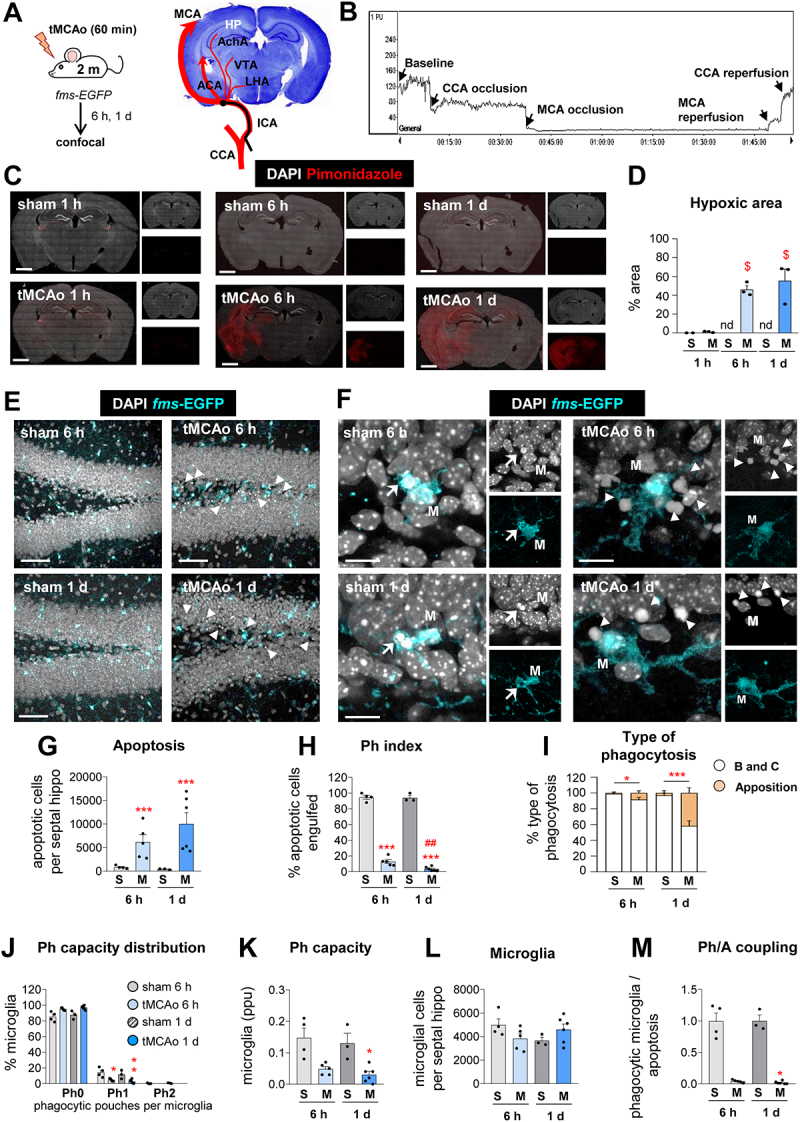
Microglial phagocytosis is impaired in mice exposed to tMCAo. (A) Experimental design of tMCAo in 2 mo fms-EGFP mice and coronal slice with cresyl violet showing the areas irrigated by the MCA. (B) Laser Doppler signal graph showing CBF in the territory supplied by MCA during baseline, CCA and MCA occlusion, and reperfusion. Successful MCA occlusion, determined by CBF > 70% drop from the baseline, recovers after reperfusion. The values are expressed in arbitrary Perfusion Units (PU). (C) Representative tiled confocal image of coronal hippocampi showing cell nuclei (with DAPI, in white) and hypoxic areas labeled with the hypoxic probe pimonidazole (in red) in 2-mo fms-EGFP mice after sham (S) and tMCAo (M) treatment at 1 h, 6 h and 1 d. (D) Percentage of hypoxic brain area determined by pimonidazole (in red) after tMCAo at 6 h and 1 d. The pimonidazole signal was not detected (nd) in sham animals. (E) Representative confocal z-stacks of the DG of fms-EGFP mice at 6 h and 1 d after tMCAo. Cell nuclei were visualized with DAPI (in white) and microglia by EGFP (in cyan). Apoptotic cells are marked with arrowheads. (F) Representative confocal z-stacks from the septal DG of a sham and tMCAo-treated mice at 6 h and 1 d, showing apoptotic cells non-phagocytosed (arrowheads) or phagocytosed (arrows) by microglia (fms-EGFP+, in cyan; M). (G) Number of apoptotic cells per septal hippocampus in sham and tMCAo. (H) Ph index in the septal hippocampus (% of apoptotic cells engulfed by microglia). (I) Type of microglial phagocytosis (% of “ball and chain” or “apposition” mechanism). (J) Histogram showing the Ph capacity of microglia (% of microglia with phagocytic pouches). (K) Weighted Ph capacity (% of microglia with phagocytic pouches). (L) Number of fms-EGFP+ microglia per septal hippocampus. (M) Ph/A coupling (in fold change) in the septal hippocampus. Bars show mean ± SEM. In (D), n = 2 (sham at 1 h), n = 3 (sham 6 h and 1 d), and n = 3 (tMCAo at 1 h, 6 h, and 1 d); (G-M), n = 3 mice (sham at 6 h), n = 4 mice (sham at 1 d), n = 5 mice (tMCAo at 6 h) and n = 6 mice (tMCAo at 1 d).Data were analyzed using one-way ANOVA using Holm-Sidak post hoc test (D). The effect of sham/tMCAo at 6 h and 1 d on apoptosis (G), Ph index (H), Type of phagocytosis (I), Ph capacity distribution (J), Ph capacity (K), Microglia (L) and Ph/A coupling (M) was analyzed using two-way ANOVA. Significant interactions were found between the two factors (tMCAo treatment x time); therefore, data were split into two one-way ANOVAs to analyze statistical differences due to the time after sham/ tMCAo at each time. Holm-Sidak was used as a post hoc test. To comply with homoscedasticity, some data were Log10 (G, K) or (Log10 + 1) transformed (I, J, M). In case that homoscedasticity was not achieved with the transformation, data were analyzed using a Kruskal-Wallis ranks test, followed by Dunn method as a post hoc test (I, J, M). (* and #) represent significance compared to sham and/or tMCAo at 6 h respectively. One symbol represents p < 0.05, two p < 0.01, and three p < 0.001. Only significant effects are shown. Scale bars: 500 μm (C); 50 μm, z = 18.9 μm (E); 14 μm, z = 16 μm (F).
