Figure 3.

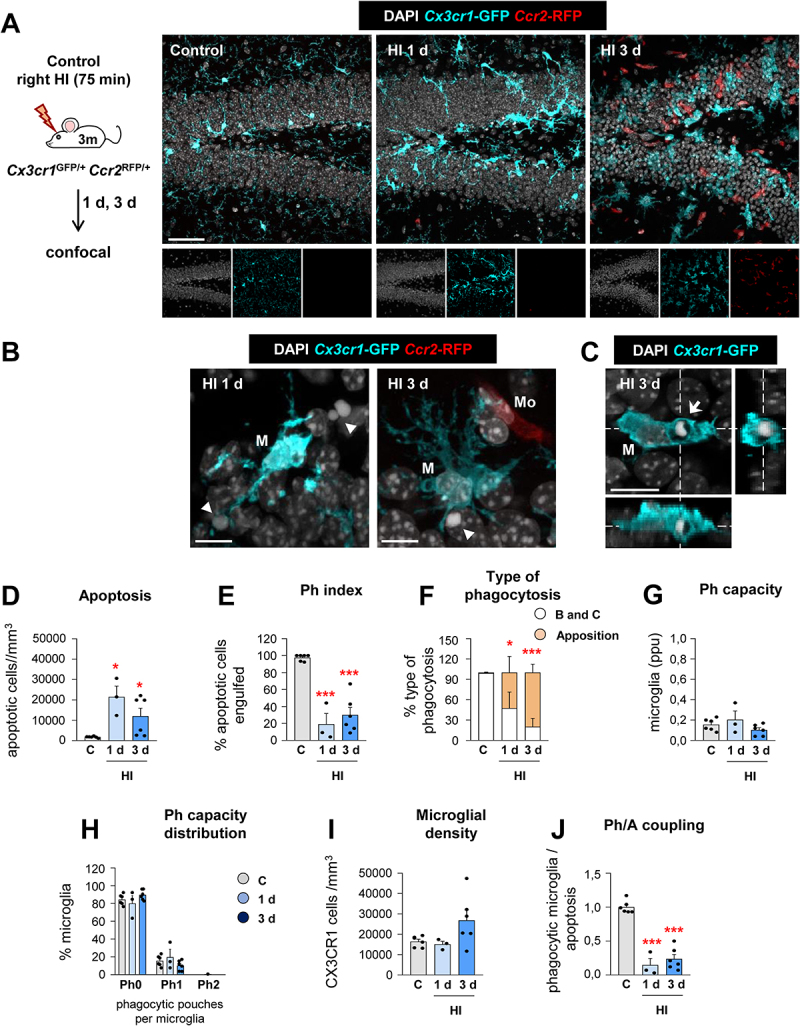
Microglial phagocytosis is impaired during HI. (A) Experimental design and representative confocal z-stack of the DG of 3 mo Cx3cr1-GFP Ccr2-RFP mice at 1 and 3 d under HI. Cell nuclei were visualized with DAPI (in white), microglia (Cx3cr1-GFP+, in cyan) and monocytes (Ccr2-RFP+, in red). (B) Representative confocal z-stack from the DG of a HI-treated mouse at 1 and 3 d showing apoptotic cells (arrowheads) non-phagocytosed by microglia (Cx3cr1-GFP+, in cyan; M), close to monocytes (Ccr2-RFP+, in red; Mo). (C) Orthogonal projection of a confocal z-stack from the septal DG of a HI-treated mouse at 3 d showing an apoptotic cell (arrow) phagocytosed by microglia (Cx3cr1-GFP+, in cyan; M). (D) Density of apoptotic cells (cells/mm3) in the septal DG under control and HI treatment. (E) Ph index in the septal DG (in % of apoptotic cells engulfed by microglia). (F) Type of microglial phagocytosis (% of “ball and chain” or “apposition” mechanism). (G) Weighted Ph capacity under control and HI conditions. (H) Histogram showing the Ph capacity of microglia (% of microglia with pouches). (I) Density of Cx3cr1-GFP+ microglia (cells/mm3) in the septal DG. (J) Ph/A coupling (in fold change) in the septal DG. Bars represent mean ± SEM. n = 5 (control), n = 3 (at 1 d) and n = 6 (at 3 d). Data were analyzed by one-way ANOVA, using Holm-Sidak as post hoc test. To comply with homoscedasticity, some data were Log10 (D, H) and/or Log10 + 1 (G) transformed. In the case that homoscedasticity was not achieved with a logarithmic transformation data were analyzed using a Kruskal-Wallis rank test, followed by Dunn method as a post hoc test (D, G). One (*) symbol indicates p < 0.05, and three p < 0.001 (vs control). Scale bars: 50 μm, z = 16 μm (A); 20 μm, z = 15 μm (B); 10 μm, z = 14 μm (C).
