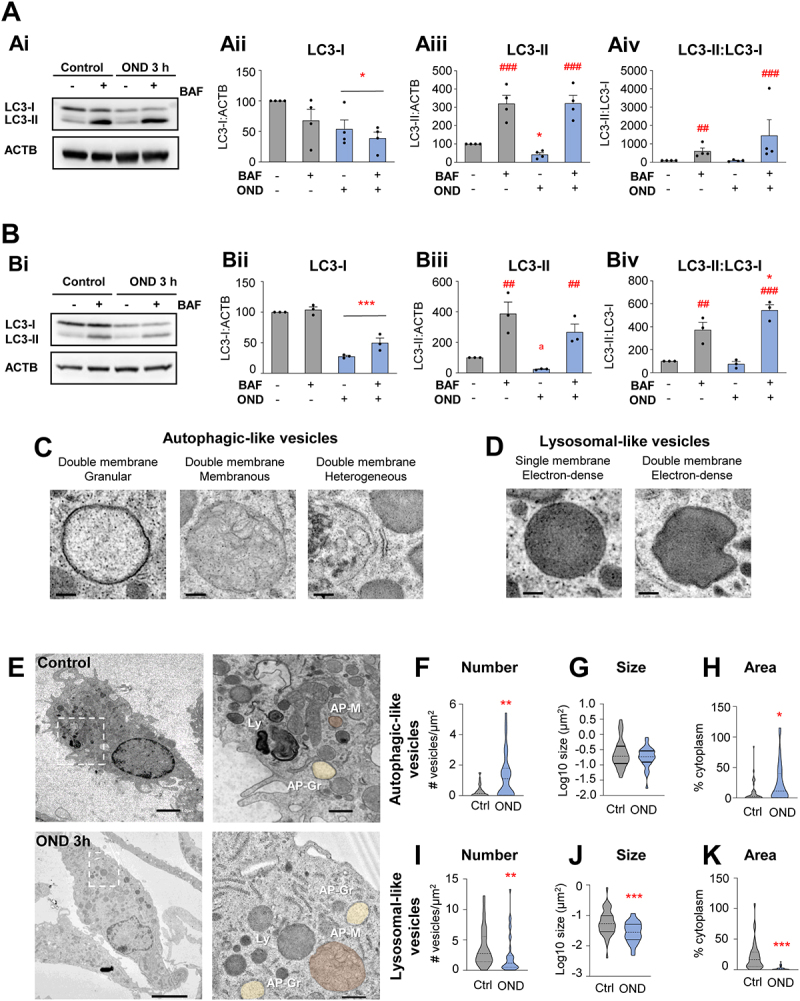
Figure 9.

Complementary autophagy analysis in microglial cultures after OND. (A) Primary microglia were exposed to OND for 3 h in the presence and absence of bafilomycin A1 (BAF, 100 nM, 3 h) to assess autophagy flux by LC3 turnover assay. Delipidated (~1 KDa) and lipidated (~17 KDa) LC3 levels were analyzed by western blot. ACTB (~42 KDa) was used as a loading control. Representative blots showing LC3-I, LC3-II and ACTB bands (Ai), LC3-I levels normalized to ACTB (Aii), LC3-II levels normalized to ACTB (Aiii), LC3-II levels normalized to LC3-I levels (Aiv). (B) BV2 cells were exposed to OND for 3 h in the presence and absence of bafilomycin A1 (BAF, 100 nM, 3 h) to assess autophagy flux by LC3 turnover assay. Delipidated (~1 KDa) and lipidated (~17 KDa) LC3 levels were analyzed by western blot. ACTB (~42 KDa) was used as loading control. Representative blots showing LC3-I, LC3-II and ACTB bands (Bi), LC3-I levels normalized to ACTB (Bii), LC3-II levels normalized to ACTB (Biii), LC3-II levels normalized to LC3-I levels (Biv). (C) Details of autophagic-like vesicles identified as containing at least a portion of double membrane with different types of cargo (granular, membranous, heterogeneous). (D) Details of lysosomal-like vesicles identified as electron-dense vesicles with single or double membrane. (E) Representative TEM images of primary microglia in control and OND conditions. Ly: lysosomes; AP-Gr: autophagosomes with granular cargo (yellow); AP-M: autophagosomes with membranous cargo (Orange). (F-H) Quantification of autophagic-like vesicle number per µm2 (F), size in µm2 (in logarithmic scale) (G), and percentage of cytoplasm occupied (H). (I-K) Quantification of lysosomal-like vesicle number per µm2 (I), size in µm2 (in logarithmic scale) (J), and percentage of cytoplasm occupied (K). Bars show mean ± SEM (A, B). Violin plots show the data distribution, including extreme values; lower and upper hinges correspond to the first and third quartile, respectively (F-H, I-K). n = 4 independent experiments (A); n = 3 independent experiments (B); n = 36–38 cells from 3 independent experiments (F-H, I-K). Data were analyzed by two-way ANOVA followed by Holm-Sidak post hoc test (A). When a trend for a significant interaction between factors was found (Aiii, OND x BAF interaction: p = 0.08), one-way ANOVA (factor: treatment) was performed followed by Holm-Sidak post hoc test (Aiii). To comply with homoscedasticity some data were square root (Aiii) or Log10 transformed (Aiv). Data were analyzed by two-way ANOVA followed by Holm-Sidak post hoc test (B). When a trend for a significant effect of factors was found (Biii, OND factor: p = 0.067), analysis was followed by Holm-Sidak post-hoc tests (Biii). When an interaction between factors was found, one-way ANOVA (factor: treatment) was performed followed by Holm-Sidak post hoc tests (Biv). Data were analyzed by one-way ANOVA followed by non-parametric Mann-Whitney test (F-H, I-K) (* and #) represent significance: one symbol represents p < 0.05, two symbols represent p < 0.01 and three symbols represent p < 0.001. Scale bars: 500 nm (C, D); 2 µm (control), 5 µm (OND), 500 nm (high magnification) (E).
