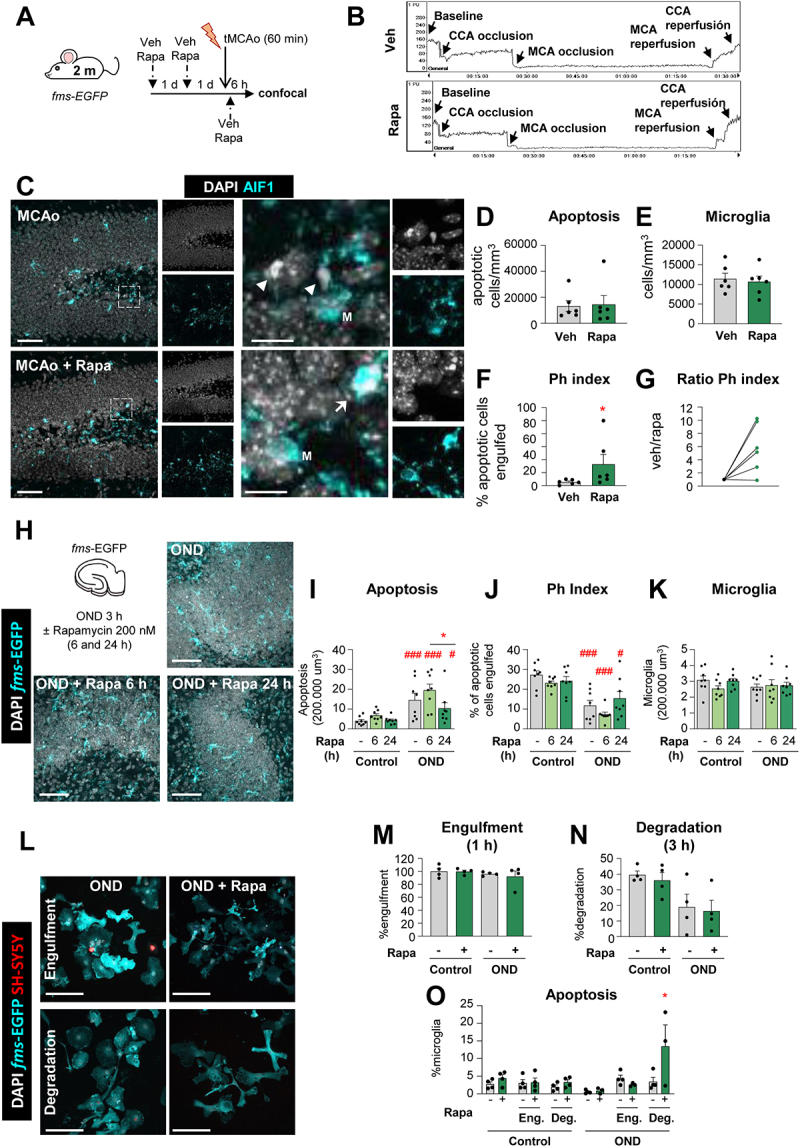
Figure 11.

Rapamycin reverts the tMCAo-induced phagocytic dysfunction in vivo but not in vitro. (A) Experimental design showing the daily administration of rapamycin (10 mg/kg, ip) two days prior to the tMCAo in 2 mo fms-EGFP mice. Mice received a third rapamycin injection right after reperfusion, and were sacrificed 6 h later. (B) Representative laser Doppler signal graph showing the effective MCA occlusion and reperfusion in both vehicle and rapamycin-treated mice. (C) Representative confocal z-stacks of the DG of fms-EGFP mice 6 h after tMCAo, treated with vehicle or rapamycin (10 mg/kg, ip). Cell nuclei were visualized with DAPI (in white) and microglia (fms-EGFP+, in cyan). Arrowheads point to non-phagocytosed apoptotic cells and arrows to phagocytosed apoptotic cells. M labels a microglial soma. (D) Density of apoptotic cells in the septal hippocampus. (E) Density of microglial cells in the septal hippocampus. (F) Ph index in the septal hippocampus (% of apoptotic cells engulfed by microglia). (G) Normalized ratio of Ph index change in each rapamycin-treated mice over its same day vehicle-treated mice. (H) Experimental design and representative confocal images of hippocampal organotypic cultures treated with vehicle or rapamycin (200 nM; 6 and 24 h) exposed to OND (3 h). Normal or apoptotic (pyknotic-karyorrhectic) nuclear morphology was visualized with DAPI (white) and microglia by the transgenic expression of fms-EGFP (cyan). Rapamycin- and vehicle- treated control cultures are shown in Fig. S8A. (I) Number of apoptotic cells in 200,000 µm3 of the DG. (J) Ph index (% of apoptotic cells phagocytosed by microglia). The weighted Ph capacity and the Ph/A coupling are shown in Fig. S8B, C. (K) Number of microglia in 200,000 µm3 of the DG. (L) Representative confocal images of microglia (fms-EGFP+, cyan) engulfing (1 h) and degrading (3 h) apoptotic SH-SY5Y VAMPIRE neurons (red) under OND conditions in the presence of rapamycin. Nuclear morphology was assessed with DAPI (white). Only particles fully enclosed by microglia were identified as phagocytosis. A table summarizing the treatments is shown in Fig. S8D, the effect of rapamycin in LC3 levels is shown in Fig. S8E, and control cells are shown in Fig. S8F. (M, N) Percentage of phagocytic microglia after engulfment (1 h) and degradation (3 h after engulfment). (O) Percentage of apoptotic (pyknotic-karyorrhectic) microglia after the phagocytosis assay and rapamycin treatment in both control and OND. Bars show mean ± SEM. Dot and line plot represents the normalized ratio between rapamycin- and vehicle-treated animals (by pairs). n = 6 mice per group (D-G), n = 8 mice per group (I-K), and n = 4 independent experiments (M-O). Data were analyzed using a Student´s t-test (D-G); by two-way ANOVA followed by Holm-Sidak post hoc tests when appropriate (I-K, M-N); or by one-way ANOVA followed by Tukey´s post hoc test when a significant interaction in two-way ANOVA was found (O). Some data (I) was Log10 transformed to comply with homoscedasticity. Asterisks represent significance between untreated and rapamycin-treated mice or cultures: (*) represents p < 0.05. (#) represent significance between OND and control cultures: # represents p < 0.05, and ### represents p < 0.001. Scale bars = 50 µm, z = 19.6 µm; inserts bar = 10 µm z = 9.8 µm (C); 50 µm, z = 11.2 µm (H); 50 µm, z = 8.5 µm (L).
