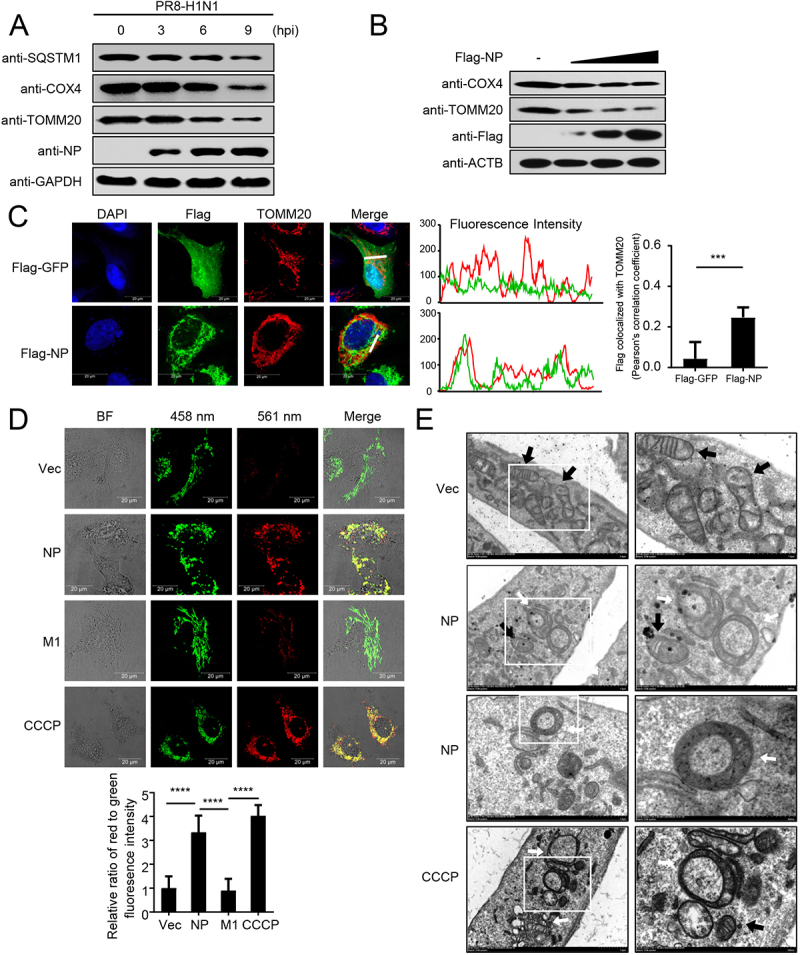
Figure 1.

PR8 NP induces mitophagy. (A) HEK293T cells were infected with PR8 virus for the indicated times before WB (western blotting). (B) HEK293T cells were transfected with increasing amounts of Flag-NP for 24 h before WB. (C) NP colocalizes with TOMM20. U2OS cells were transfected with Flag-NP or Flag-GFP plasmids. Twenty hours later, the cells were fixed with 4% paraformaldehyde and stained with anti-Flag before confocal microscopy. The middle panels show the red (TOMM20) and green (Flag) pixel intensity. Scale bar: 20 μm. The right panel shows the quantification of Pearson’s colocalization coefficient between TOMM20 and Flag. (D) U2OS cells expressing mito-keima were transfected with empty vector (Vec), Flag-NP, Flag-M1, or treated with CCCP (as a control to induce mitophagy), respectively. Twenty hours later, the cells were imaged with 458-nm and 561-nm laser excitation for mito-keima. BF indicates the bright field images. Scale bar: 20 μm. The bottom panel shows the quantification of the relative ratio of fluorescence intensity (561 nm:458 nm) of the cells. (E) Electron microscopy images from U2OS cells transfected with a Flag-NP plasmid or treated with CCCP. The black arrows indicate mitochondria; the white arrows indicate mitophagic vacuoles. Results are representative of three independent experiments.
