Figure 5.

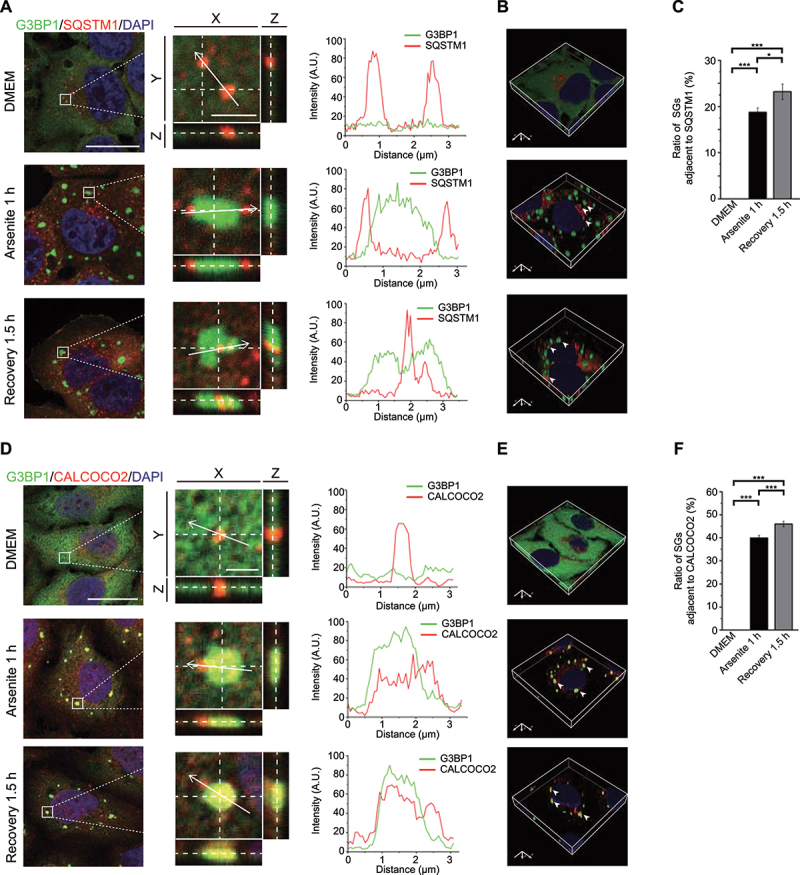
Endogenous SQSTM1 and CALCOCO2 are associated with SGs upon arsenite treatment and during recovery from oxidative stress. (A and D) HeLa cells were untreated, treated with arsenite for 1 h, or recovered for 1.5 h after removal of arsenite. Cells were fixed and stained with G3BP1 (green), nuclei (DAPI, blue) and SQSTM1 (red) (A) or CALCOCO2 (red) (D). Left, Z-stack projection of the images; scale bar: 20 μm. Middle, magnified orthogonal sectioning view of regions in the boxes; scale bar: 2 μm. Right, Line graphs show fluorescence plots along the white arrow. (B and E) 3D reconstructed images after Z-section confocal analysis. Arrows indicate adjacent localization of G3BP1 and SQSTM1 (B) or CALCOCO2 (E). (C and F) Percentage of SGs adjacent to SQSTM1 or CALCOCO2 as represented in (A) and (D). Data are presented as means ± SEMs from three independent experiments with 300 cells counted. *p < 0.05, ***p < 0.001 (one-way ANOVA with Tukey’s test).
