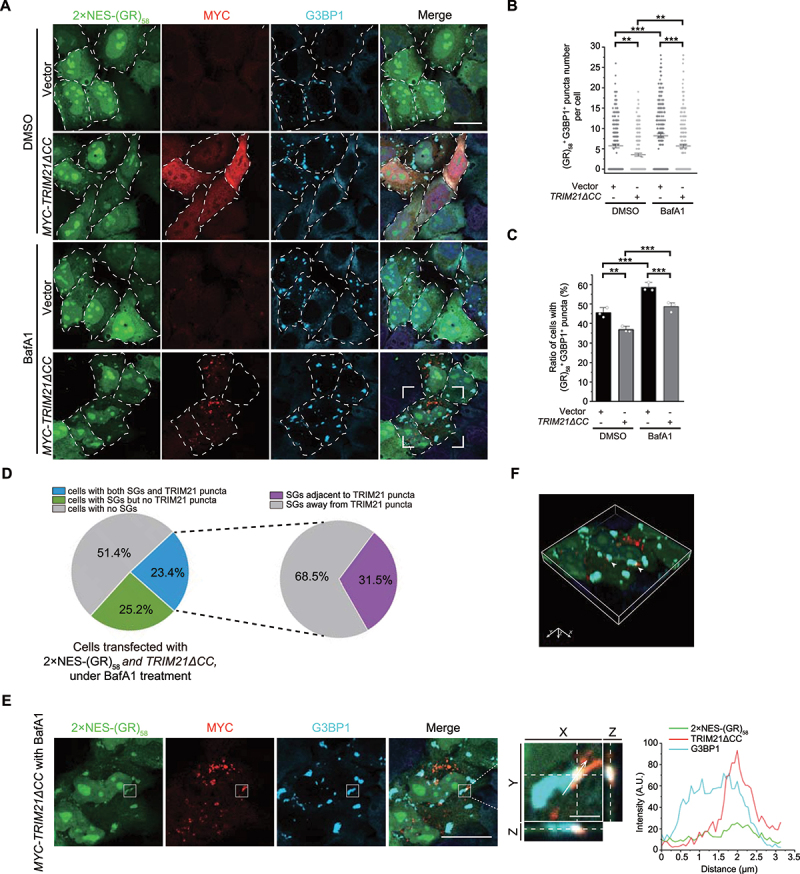
Figure 6.

TRIM21 inhibits the pathological SG formation. (A) HeLa cells were transfected with 2xNES-(GR)58, along with the empty vector or MYC-TRIM21ΔCC, and treated without or with 100 nM BafA1 for 4 h. Cells were fixed and stained with MYC (red), G3BP1 (cyan) and nuclei (DAPI, blue). Scale bar: 20 μm. (B) Quantification of the number of (GR)58- and G3BP1-colocalized SGs per cell from (A). Data were pooled from three independent experiments with 200 cells counted. Error bars indicate SEM. **p < 0.01, ***p < 0.001 (one-way ANOVA with Tukey’s test). (C) Quantification of the percentage of cells with SGs from (A). Data are presented as means ± SEMs from three independent experiments with 200 cells counted. **p < 0.01, ***p < 0.001 (one-way ANOVA with Tukey’s test). (D) HeLa cells were transfected with 2×NES-(GR)58 and TRIM21ΔCC and then treated with 100 nM BafA1. 51.4% of cells had no SGs, 25.2% of cells had SGs but no TRIM21 puncta, and 23.4% of cells had both 2xNES-(GR)58 SGs and TRIM21 puncta. In the 23.4% of cells with both 2xNES-(GR)58 SGs and TRIM21 puncta, 31.5% of 2xNES-(GR)58-positive SGs were adjacent to TRIM21 puncta. (E) The enlarged image of the white square drawn in the bottom row in (A). TRIM21 is localized to the periphery of G3BP1- and 2×NES-(GR)58-colocalized puncta. Left, Z-stack projection of the images; scale bar: 20 μm. Middle, magnified orthogonal sectioning view of regions in the boxes; scale bar: 2 μm. Right, Line graphs show fluorescence plots along the white arrow. (F) A 3D reconstructed image after Z-section confocal analysis. Arrows indicate the colocalized G3BP1, 2×NES-(GR)58 and TRIM21.
