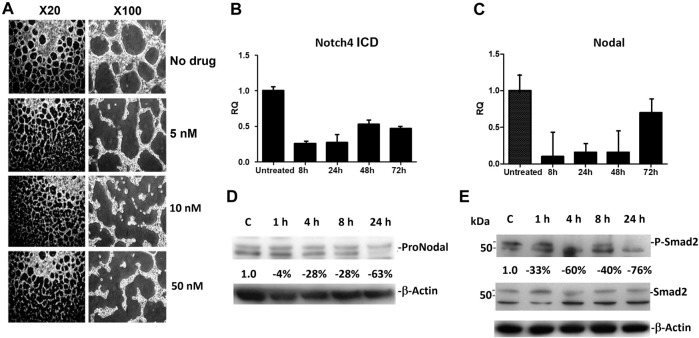
FIGURE 3.
Effect of CVM-1118 on vasculogenic mimicry signaling molecules (A) In vitro standard VM assay in C8161 cells after treatment with CVM-1118 using various concentrations. ×20: 20-fold magnification. ×100: 100-fold magnification. (B,C) Quantitative Real Time PCR analysis of Notch4 ICD and Nodal after 10 nM of CVM-1118 treatment for 8, 24, 48, and 72 h in C8161 cells. RQ: Relative quantification of RNA expression level. (D) Protein level of ProNodal was determined by Western blot analysis after treatment with 10 nM CVM-1118 for 1, 4, 8, and 24 h. The percentage changes were corrected for protein loading using β-actin. (E) Cells were untreated (Control) or treated with 10 nM CVM-1118 for 1, 4, 8, and 24 h. The changes in the expression of Smad2 and phosphorylated Smad2 (P-Smad2) proteins (relative to β-actin) were determined by Western blot analysis. The percentage change is the reduction of protein expression ratio of P-Smad2 to Smad2 protein level relative to β-actin against the ratio in the Control cells.

