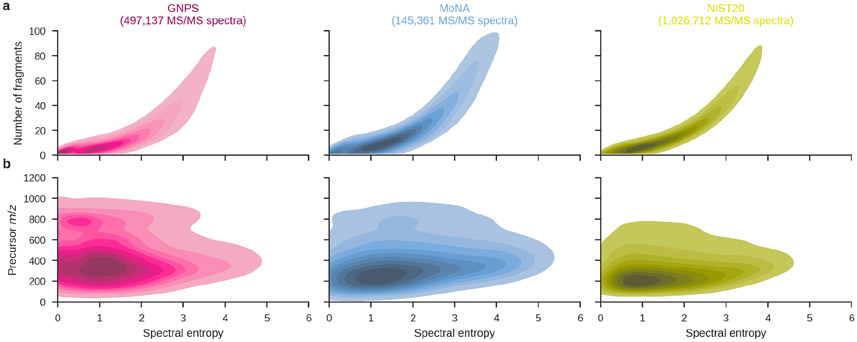
Figure 4:
Spectral entropy distributions for the GNPS, MoNA, and NIST20 spectral libraries. GNPS consists of 497,137 MS/MS spectra from the “ALL_GNPS_NO_PROPOGATED” library (downloaded on 2022-09-08), MoNA contains 145,361 MS/MS spectra from the “LC-MS/MS Spectra” collection (downloaded on 2022-09-08), and NIST20 consists of 1,026,712 MS/MS spectra (high-resolution MS/MS collection). Spectra were processed by removing noise peaks below 1% of the base peak intensity and normalizing fragment intensities to sum to one. (a) There is a strong relationship between spectral entropy and the number of fragment ions (Spearman correlation 0.963). (b) Although the NIST20 library contains smaller molecules than GNPS and MoNA, the difference in entropy distributions cannot be directly explained by the weight of the molecules (Spearman correlation 0.095).

