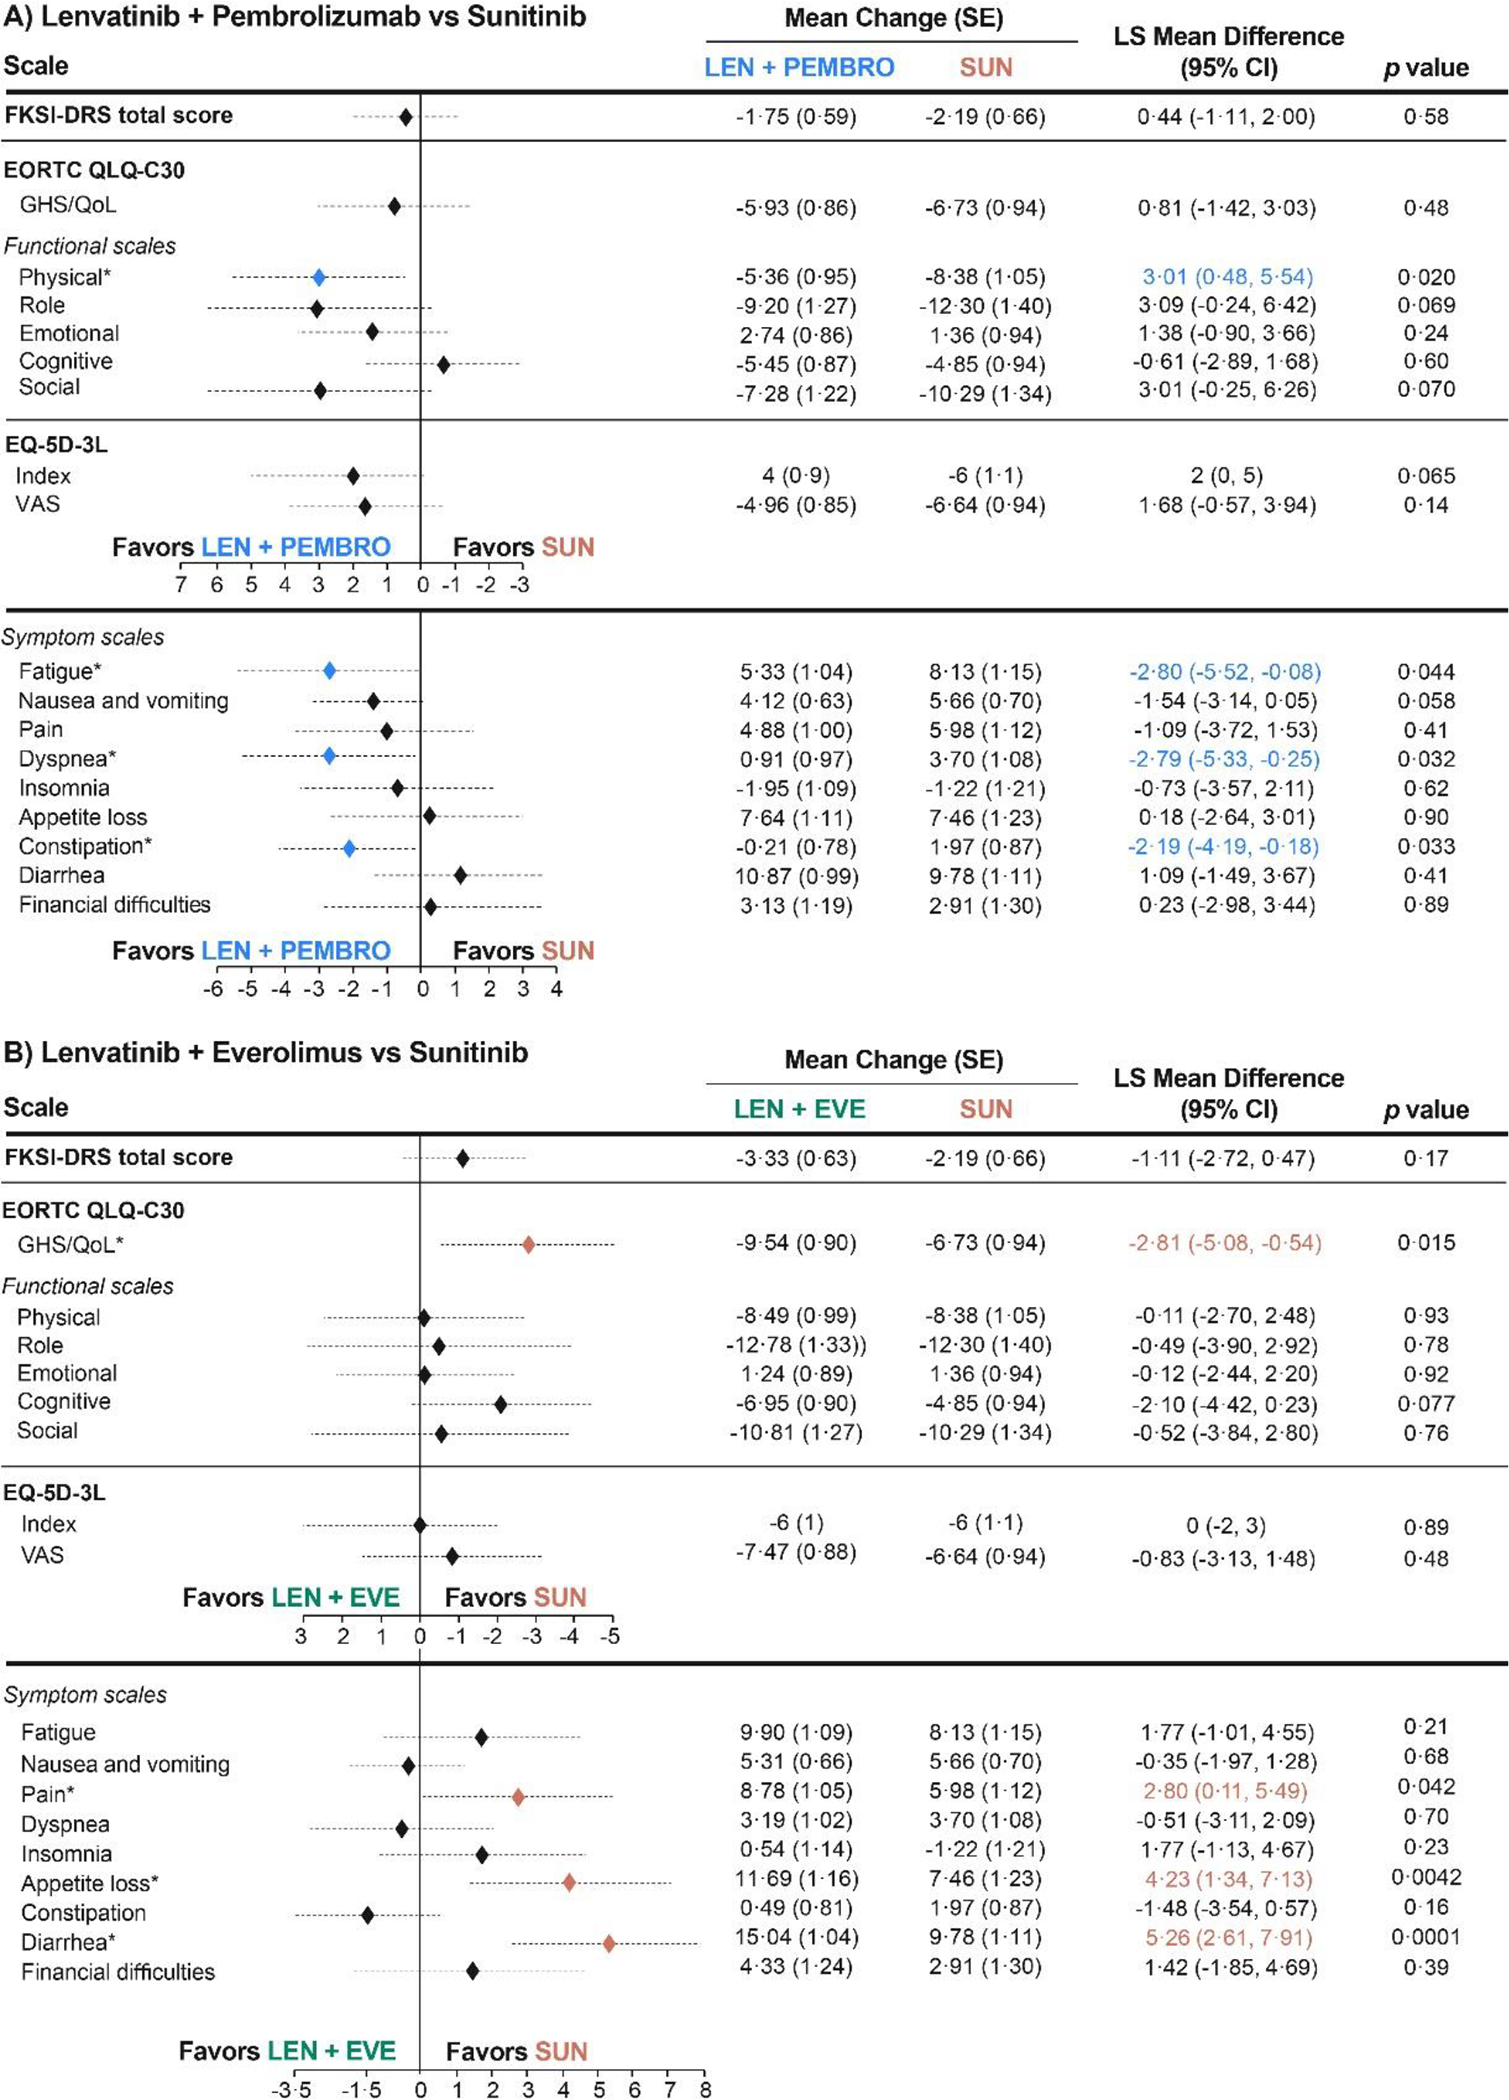
Figure 2. Least-Squares Mean Differences for Change From Baselinea.

aThe overall least-squares mean difference was estimated at mean follow-up (46 weeks, cycle 15). For presentation, scores from the FKSI-DRS and EQ-5D-3L Index instruments were transformed to the scale of 0–100 (FKSI-DRS transformed score = (raw score/36)*100; EQ-5D-3L Index transformed score = (raw score)*100). For the FKSI-DRS total score, EORTC QLQ-C30 GHS/QoL and functional scales, and EQ-5D-3L scales, a higher score corresponds to better HRQoL. For EORTC QLQ-C30 symptom scales, a higher score represents worse symptoms *Statistically significant difference (P < 0·05).
CI, confidence interval; EORTC QLQ-C-30, European Organization for Research and Treatment of Cancer Quality of Life Questionnaire; EQ-5D-3L, EuroQol 5 Dimensions 3 Levels; EVE, everolimus; FKSI-DRS, Functional Assessment of Cancer Therapy Kidney Symptom Index–Disease-related Symptoms; GHS/QoL, global health status/quality of life; HRQoL, health-related quality of life; LEN, lenvatinib; LS, least squares; PEMBRO, pembrolizumab; SUN, sunitinib.
