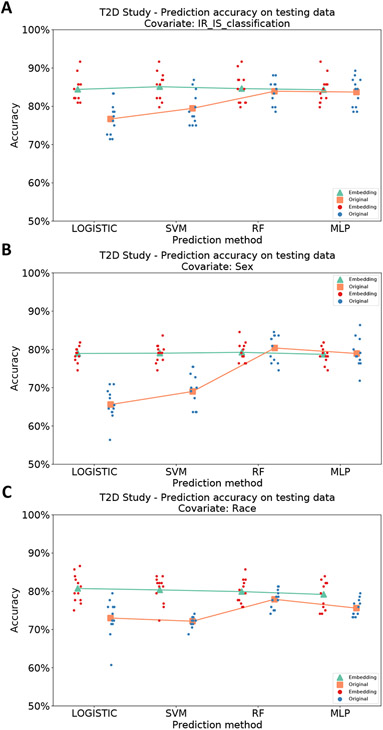
Figure 3.
Scatter plot of average prediction accuracies on test data from 12 random training-validation-testing splits, using different methods for categorical covariates (T2D study). Green triangles and red points represent predictions based on MB-SupCon embeddings. Orange squares and blue points represent predictions based on original microbiome data. Panel A: Insulin resistant/sensitive; Panel B: Sex; Panel C: Race. Acronyms: LOGISTIC - logistic regression with elastic net penalty; SVM - support vector machine classifier; RF - random forest classifier; MLP - multi-layer perceptron.

