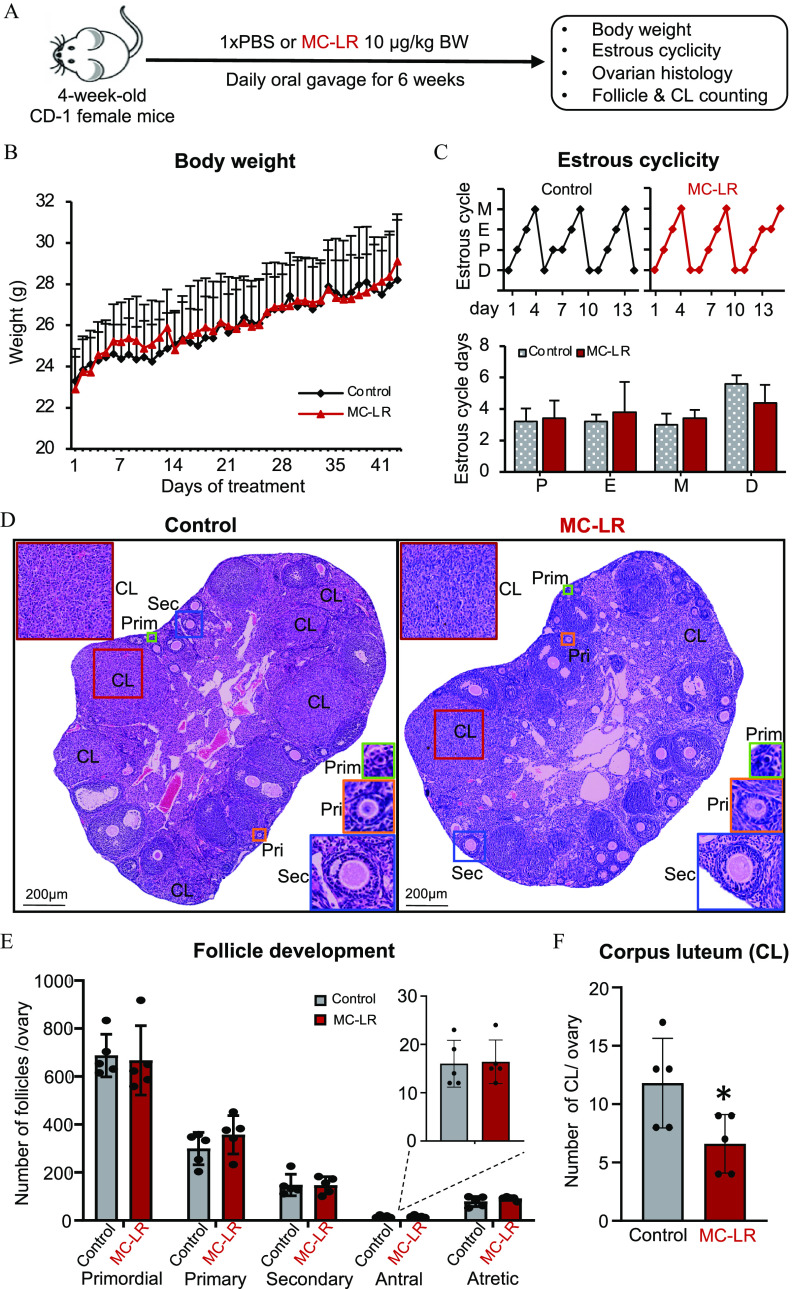
Figure 1.
Assessment of mouse body weight, ovarian cyclicity, and folliculogenesis following a long-term, low-dose oral exposure to MC-LR. (A) The schematic of long-term MC-LR oral exposure in vivo. mice in each group. (B) Effect of MC-LR on mouse body weight during the 6-wk treatment. Average daily body weight in PBS- or MC-LR–treated mice. (C) Representative 14-d estrous cyclicity (top) and the numbers of days in each estrous cycle stage (bottom) in the last 2 wk of PBS or MC-LR treatment. (D) Representative ovary histological images after 6-wk PBS or MC-LR treatment. Red squares indicate corpora lutea (CL); green squares indicate primordial follicles (Prim); orange squares indicate primary follicles (Pri); and blue squares indicate secondary follicles (Sec). (E) Total numbers of various stages of follicles per ovary in PBS- or MC-LR–treated mice. (F) Total numbers of CL per ovary in PBS- or MC-LR–treated mice. mice in each group. Data were analyzed with two-way ANOVA with Bonferroni’s post-test (B) and Student’s -test (C,E,F). Bidirectional error bars represent ; *. Data in (B,C,E,F) are also presented in Tables S2–S5, respectively. Note: ANOVA, analysis of variance; D, diestrus; E, estrus; M, metestrus; MC-LR, microcystin-LR; P, proestrus; PBS, phosphate-buffered saline.

