. 2023 Jun 21;131(6):067010. doi: 10.1289/EHP12034

Figure 3.

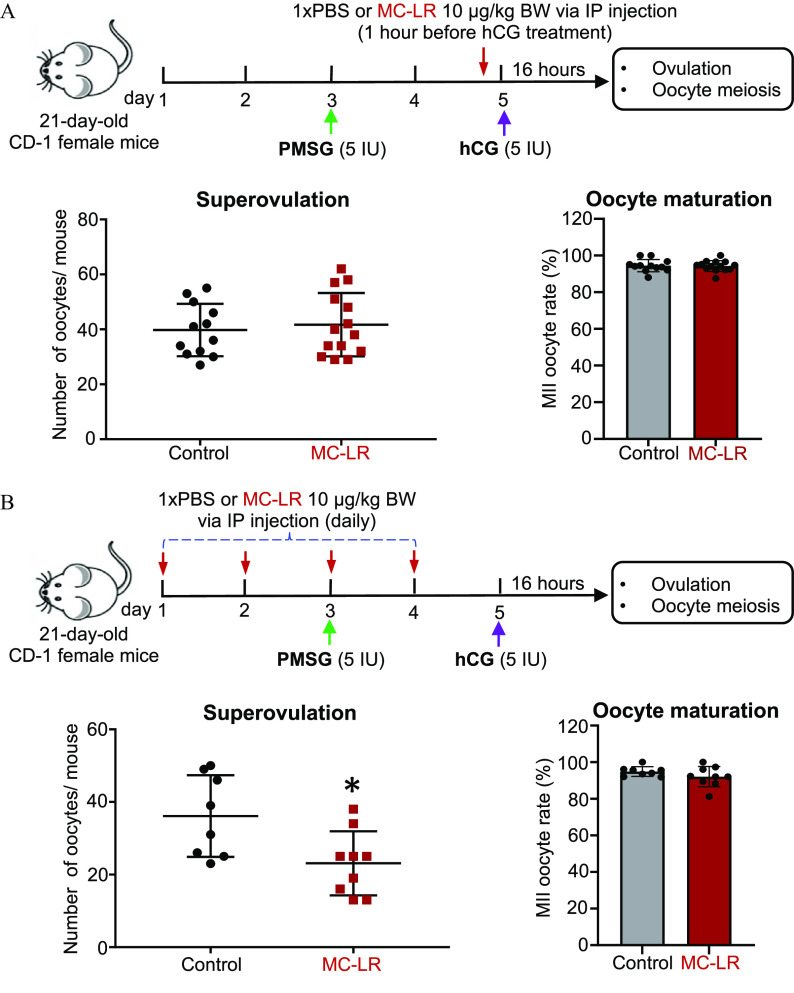
Figure 3A is a set of one schematic illustration, one dot plot, and one bar graph. The schematic illustration depicts the acute MC-LR exposure during the ovulation window. Twenty-one-day-old CD-1 female mice were exposed to P M S G (5 international units) on day 3. Between day 4 and day 5, the mice were exposed to 1 times PBS or MC-LR 10 micrograms per kilogram of body weight via IP injection (1 hour before hCG treatment). On day 5, the mice were exposed to hCG (5 international units). After 16 hours, there was ovulation and oocyte meiosis. The dot plot is titled Superovulation, plotting Number of oocytes per mouse, ranging from 0 to 80 in increments 20 (y-axis) across Control and MC-LR (x-axis). The bar graph is titled Oocyte maturation, plotting Metaphase 2 oocyte rate (percentage), ranging from 0 to 120 in increments of 20 (y-axis) across Control and MC-LR. Figure 3B is a set of one schematic illustration, one dot plot, and one bar graph. The schematic illustration depicts the acute MC-LR exposure during the follicle maturation window. Twenty-one-day-old CD-1 female mice were exposed to 1 times PBS or MC-LR 10 micrograms per kilogram of body weight via IP injection (daily) from day to day 4 and P M S G (5 international units) on day 3. On day 5, the mice were exposed to hCG (5 international units). After 16 hours, there was ovulation and oocyte meiosis. The dot plot is titled Superovulation, plotting Number of oocytes per mouse, ranging from 0 to 60 in increments 20 (y-axis) across Control and MC-LR (x-axis). The bar graph is titled Oocyte maturation, plotting Metaphase 2 oocyte rate (percentage), ranging from 0 to 120 in increments of 20 (y-axis) across Control and MC-LR.

Effects of acute MC-LR exposure during ovulation window and follicle maturation window on follicle ovulation. (A) The schematic of acute MC-LR exposure during the ovulation window. CD-1 female mice at 21-d-old were intraperitoneally treated with 1× PBS (N=12) or 10μg/kg MC-LR (N=14) at 1 h before hCG injection, and the numbers of ovulated oocytes and percentages of MII oocytes at 16 h post-hCG injection. (B) The schematic of acute MC-LR exposure during the follicle maturation window. CD-1 female mice (21-d-old) were intraperitoneally treated with 1× PBS (N=8) or 10μg/kg MC-LR (N=9) from day 1 to day 4, and the numbers of ovulated oocytes and percentages of MII oocytes at 16 h post-hCG injection were determined. Data were analyzed with Student’s t-test (A,B). Bidirectional error bars represent mean±standard deviation; *p<0.05. Data in (A,B) are also presented in Tables S9 and S10, respectively. Note: hCG, human chorionic gonadotropin; IP, intraperitoneal; MC-LR, microcystin-LR; MII, metaphase II; PBS, phosphate-buffered saline; PMSG, pregnant mare serum gonadotropin.