. 2023 Jun 21;131(6):067010. doi: 10.1289/EHP12034

Figure 5.

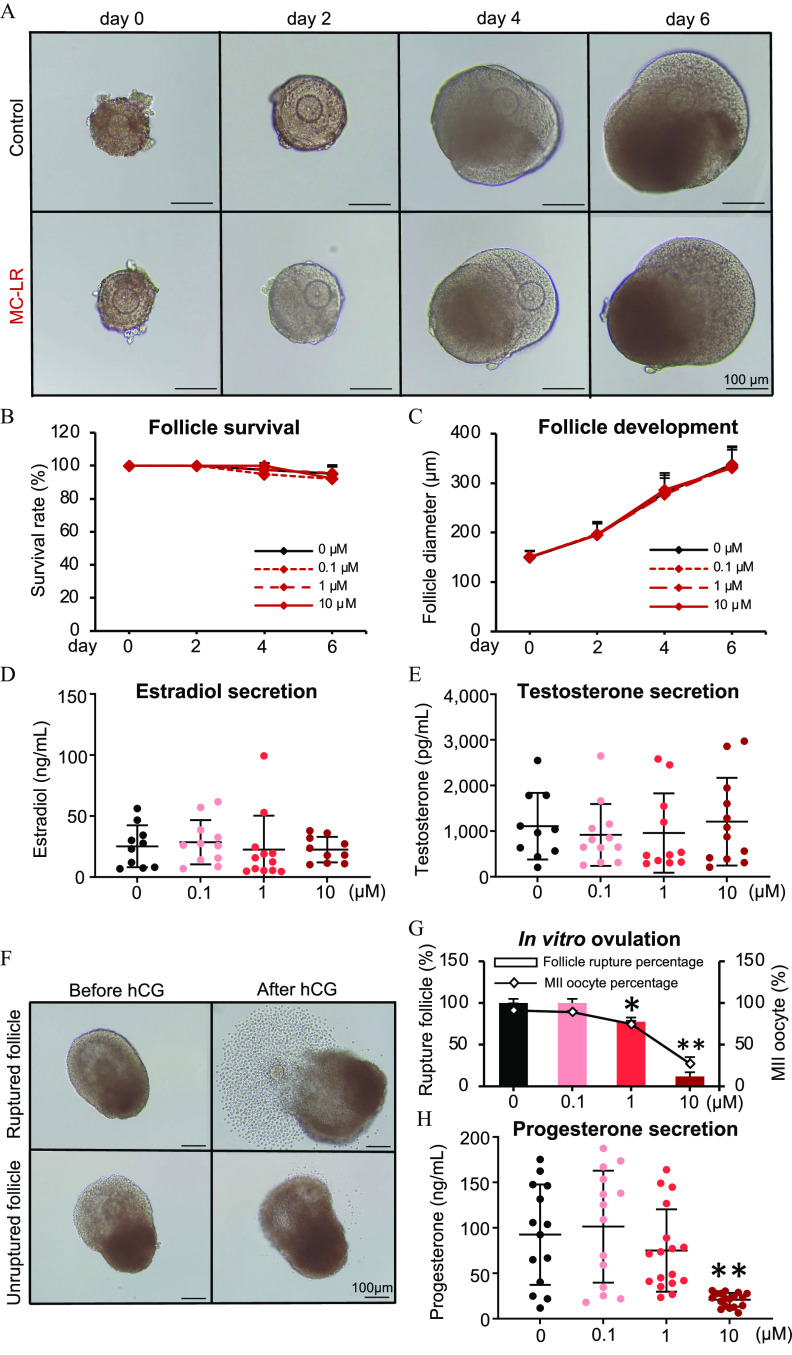
Figure 5A is a stained tissue displaying four columns, namely, Day 0, Day 2, Day 4, and Day 6 and two rows, namely, Control and MC-LR with a scale bar of 100 micrometers. Figures 5B and 5C are line graphs titled Follicle survival and Follicle development, plotting Survival rate (percentage), ranging from 0 to 120 in increments of 20 and Follicle diameter (micrometers), ranging from 0 to 400 in increments of 100 (y-axis) across Day, ranging from 0 to 6 in increments of 2 (x-axis) for 0 micrometer, 0.1 micrometer, 1 micrometer, and 10 micrometers. Figures 5D, 5E and 5H are dot plots titled Estradiol secretion, Testosterone secretion, and Progesterone secretion, plotting Estradiol (nanograms per milliliter), ranging from 0 to 150 in increments of 50; Testosterone (picograms per milliliter), ranging from 0 to 4,000 in increments of 1,000; and Progesterone (nanograms per milliliter), ranging from 0 to 200 in increments of 50 (y-axis) across micrometers, ranging from 0 to 0.1 in increments of 0.1, 0.1 to 1 in increments of 0.9; 1 to 10 in increments of 9 (x-axis), respectively. Figure 5F is a stained tissue with two columns, namely, Before hCG and After hCG and two rows, namely, Ruptured follicle and Unruptured follicle with a scale bar of 100 micrometers. Figure 5G is a bar graph titled In vitro ovulation, plotting Rupture follicle (percentage), ranging from 0 to 150 in increments of 50 (left y-axis) and Metaphase 2 oocyte (percentage), ranging from 0 to 150 in increments of 50 (right y-axis) across micrometers, ranging from 0 to 0.1 in increments of 0.1, 0.1 to 1 in increments of 0.9; 1 to 10 in increments of 9 (x-axis) for follicle rupture percentage and metaphase oocyte percentage.

Effects of MC-LR on follicle maturation, ovarian steroidogenesis, ovulation, and luteinization in vitro. (A) Representative images of follicles treated with vehicle or 10μM MC-LR during eIVFG. The (B) survival rates and (C) diameters of follicles treated with various concentrations of MC-LR. N=1314 follicles in each group per replicate, and three replicates were included. Concentrations of (D) estradiol and (E) testosterone in the conditioned follicle culture media. N=1012 follicles in each group. (F) Representative follicle images before and after hCG treatment, with vehicle- or MC-LR–treated follicles stimulated with 1.5 IU/mL hCG on day 6 of eIVFG for ovulation induction. (G) Percentages of ruptured follicles and MII oocytes in various treatment groups. (H) Concentrations of progesterone in the conditioned follicle culture media after hCG-stimulated follicles were cultured for 48 h to allow for luteinization. n=1417 follicles in each group. Data were analyzed with one-way ANOVA followed by a Tukey’s multiple comparisons test (B–E,G,H). Bidirectional error bars represent mean±standard deviation; *p<0.05 and **p<0.01. Data in (B–E,G,H) are also presented in Tables S16–S21, respectively. Note: ANOVA, analysis of variance; eIVFG, encapsulated in vitro follicle growth; hCG, human chorionic gonadotropin; MC-LR, microcystin-LR; MII, metaphase II.