. 2023 Jun 21;131(6):067010. doi: 10.1289/EHP12034

Figure 6.

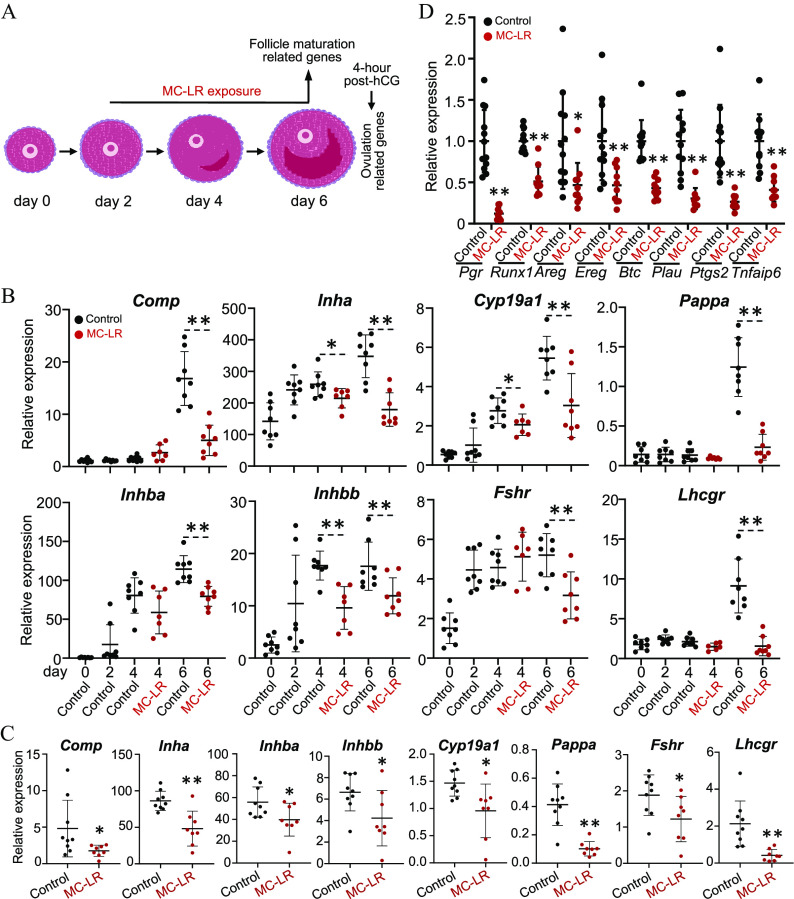
Figure 6A is a schematic illustration displaying MC-LR exposure in vitro using encapsulated in vitro follicle growth to investigate the mechanisms of MC-LR on follicle maturation and ovulation. From day 2 to day 6, MC-LR exposure and follicle maturation related genes. After 4 hours post hCG, ovulation related genes. Figure 6B is a set of eight error bar graphs. On the top, the four error bar graphs titled Comp, Inha, Cyp19a1, and Pappa, plotting Relative expression, ranging from 0 to 30 in increments 10; 0 to 500 in increments of 100; 0 to 8 in increments of 2; 0 to 2.0 in increments of 0.5 (y-axis) across Day, including 0, 2, 4, 4, 6, and 6 (x-axis) for control, control, control, MC-LR, control, and MC-LR, respectively. At the bottom, the four error bar graphs are titled Inhba, Inhbb, Fshr, and Lhcgr, plotting Relative expression, ranging from 0 to 200 in increments of 50, 0 to 30 in increments of 10, 0 to 8 in increments of 2, and 0 to 20 in increments of 5 (y-axis) across Day, including 0, 2, 4, 4, 6, and 6 (x-axis) for control, control, control, MC-LR, control, and MC-LR, respectively. Figure 6C is a set of eight error bar graphs titled Comp, Inha, Inhba, Inhbb, Cyp19a1, Pappa, Fshr, and Lhcgr, plotting Relative expression, ranging from 0 to 15 in increments of 5; 0 to 150 in increments of 50; 0 to 100 in increments of 20; 0 to 10 in increments of 2; 0.0 to 2.0 in increments of 0.5; 0.0 to 0.8 in increments of 0.2; 0 to 3 in unit increments; 0 to 6 in increments of 2 (y-axis) across Control and MC-LR (x-axis), respectively. Figure 6D is an error bar graph, plotting Relative expression, ranging from 0 to 2.5 in increments of 0.5 (y-axis) across Pgr, Runx1, Areg, Ereg, Btc, Plau, Ptgs2, and Tnfalp6, each for Control and MC-LR (x-axis) for Control and MC-LR.

Effects of MC-LR treatment on the expression of follicle maturation and ovulation-related genes in vitro. (A) The schematic of MC-LR exposure in vitro using eIVFG to investigate the mechanisms of MC-LR on follicle maturation and ovulation. (B) Expression of follicle maturation-related genes in vehicle- and MC-LR treated follicles. N=78 follicles in each group. (C) Expression of follicle maturation-related genes in isolated mural granulosa cells from vehicle- and MC-LR–treated follicles. N=89 follicles in each group. (D) Expression of established ovulatory genes in vehicle- or MC-LR–treated follicles that were collected at 4 h post-hCG. N=1012 follicles in each group. The mRNA expression levels of each gene were normalized by the expression of glyceraldehyde-3-phosphate dehydrogenase (Gapdh). Data were analyzed with one-way ANOVA followed by a Tukey’s multiple comparisons test (B) and Student’s t-test (C,D). Bidirectional error bars represent mean±standard deviation; *p<0.05 and **p<0.01. Data in (B–D) are also presented in Tables S22, S23, and S25, respectively. Note: ANOVA, analysis of variance; eIVFG, encapsulated in vitro follicle growth; hCG, human chorionic gonadotropin; MC-LR, microcystin-LR.