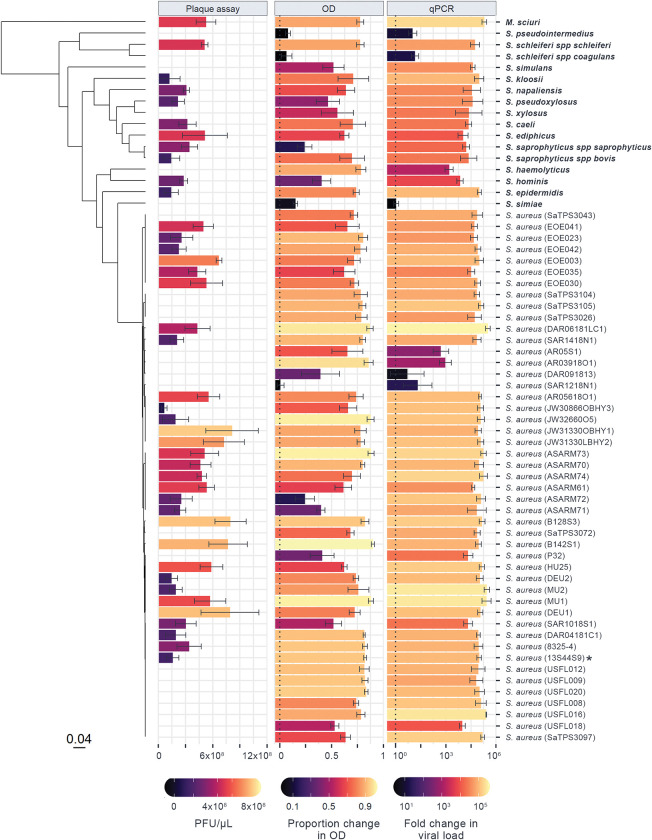
Fig 1. Susceptibility to ISP across a panel of 64 Staphylococcaceae isolates, measured using three distinct methods.
Bar lengths and colour show the mean change in ISP assessed by plaque assay (PFU/μL), optical density (proportion decrease in OD with infection after 24 hours), and qPCR (log10 fold change in viral load after 24 hours), with error bars representing the standard error of the mean across at least four biological replicates. The phylogeny of Staphylococcaceae hosts is presented on the left, with the scale bar representing the number of nucleotide substitutions per site. Strain names are presented on the right, with non-aureus species in bold and the propagation host labelled with an asterisk (a full version of the tree is available at https://doi.org/10.6084/m9.figshare.21642209.v1).

