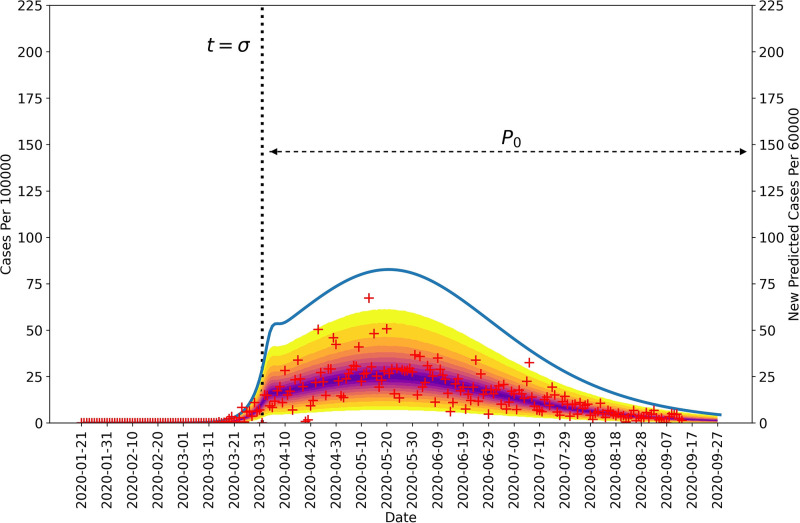
Fig 2. Posterior predictive distribution for new cases detected in the Navajo Nation between 21-January-2020 and 14-September-2020.
The daily number of new COVID-19 cases detected in the Navajo Nation are indicated by red markers. The median percentiles of posterior samples are shown in purple. The blue curve indicates daily number of new infections and is based on MAP estimates for model parameters. The vertical black dotted line represents the time at which NPIs began in the Navajo Nation. The horizontal black dotted line indicates the duration of the initial NPI phase. It should be noted that the left and right vertical scales are different.

