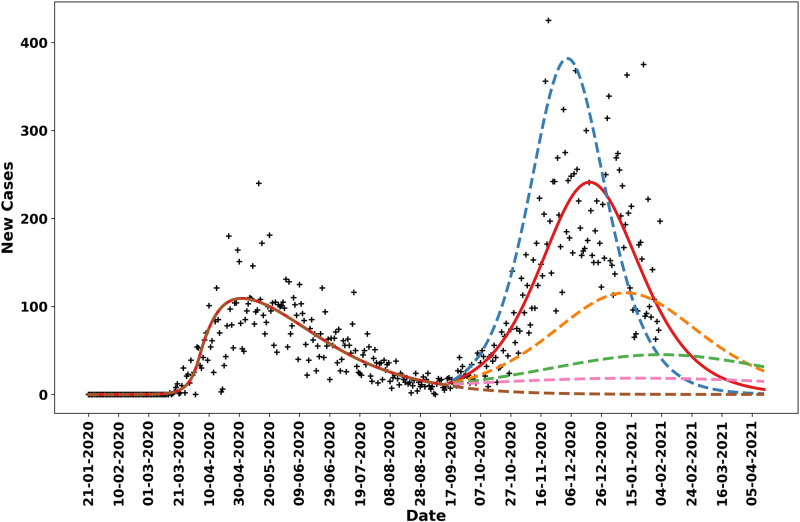
Fig 6. Model-derived projections for various scenarios in which the NPI parameter p1, which indicates the fraction of the population practicing disease-avoiding behaviors in a second NPI phase in the Navajo Nation starting 14-September-2020, was adjusted to identify the threshold required to prevent a second surge in cases.
The red solid line corresponds to the MAP estimate for p1, which is approximately 0.19. The blue broken line indicates the predicted trajectory for daily cases when p1 is fixed at 0.15. The orange broken line corresponds to a scenario wherein p1 is fixed at 0.22, the green broken line corresponds to a scenario wherein p1 is fixed at 0.25, the pink broken line corresponds to a scenario wherein p1 is fixed at 0.27, and the brown broken line corresponds to a scenario wherein p1 is fixed at 0.35.

