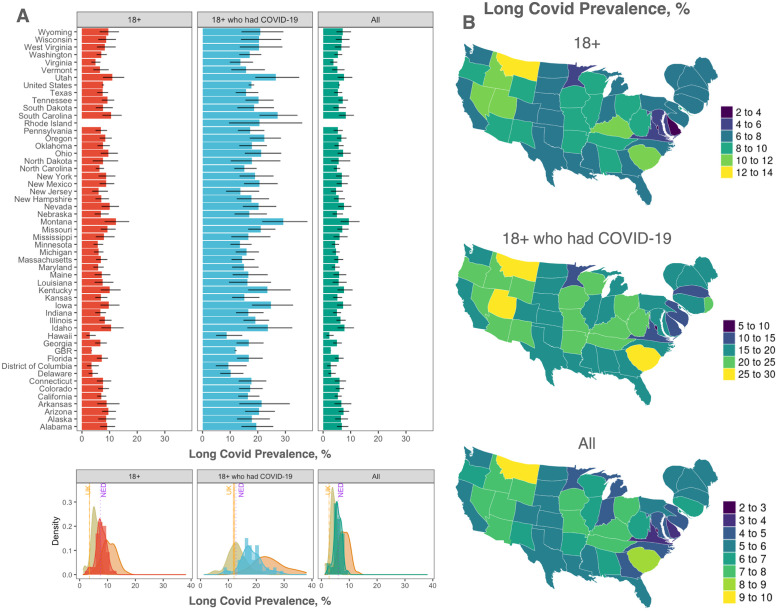
Fig 2. Long COVID prevalence from national surveys.
(A) Long COVID prevalence in each U.S. state, the U.S. and the U.K. (labeled as GBR) for the same reference populations in panel A (top) and the distribution of their mean, color-coded consistently with the top panels, and the distribution of the corresponding extremal values—i.e., the 95% lower and upper bounds—(middle). For comparison, we have reported the estimates from the U.K. and the Netherlands [51] as vertical lines. (B) Geographic distribution of the prevalence in the corresponding reference populations by means of density-equalizing maps (Methods). Maps are produced with the software R, package maps, based on Natural Earth free vector and raster map data.

