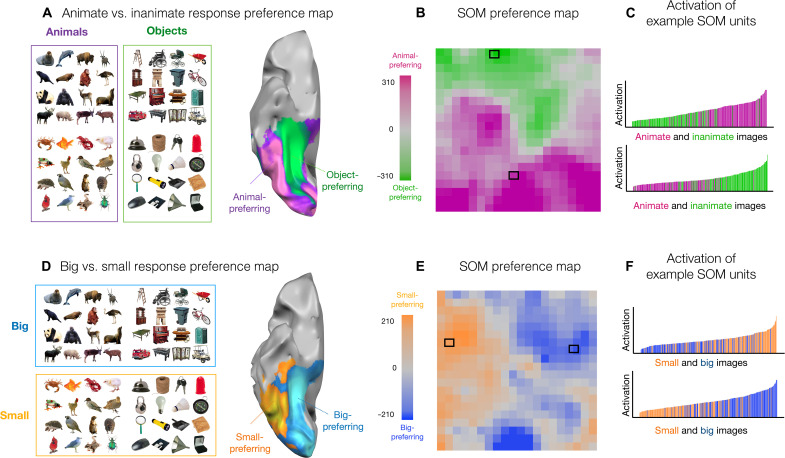
Fig. 2. Large-scale organization of animacy and size.
(A) Example images of animals and objects are shown adjacent to the corresponding brain preference map. A ventral view of a partially inflated hemisphere is shown where regions with stronger responses to depicted objects are shown in green and stronger responses to depicted animals are shown in purple. (B) Each unit of the simulated cortex is colored by its response preference to either animal or object images. (C) Two units were selected that show the maximum distinction (computed using t tests) between animate and inanimate objects. For both of these units, the degree of activation (y axis) is plotted for all 240 localizer images (x axis), sorted by their activation. (D) Same images as in (A) but now grouped by whether they depict big or small entities in the world adjacent to the corresponding brain preference map. (E) Each unit of the simulated cortex is colored by its response preference for images of big or small entities. Stimuli and brain maps adapted from (9). (F) Two units were selected that show the maximum distinction (computed using t tests) between small and big entities. For both of these units, the degree of activation (y axis) is plotted for all 240 localizer images (x axis), sorted by their activation.

