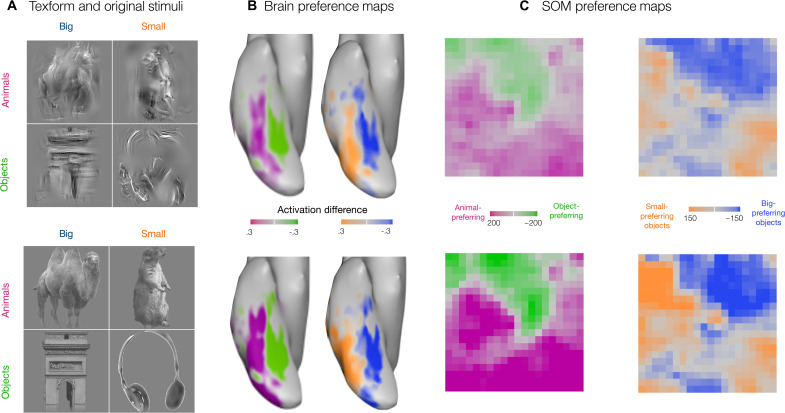
Fig. 3. Sensitivity to mid-level featural distinctions.
(A) Texform images (top) generated using a texture synthesis algorithm from recognizable images (bottom) of 30 big objects, 30 small objects, 30 big animals, and 30 small animals. (B) Preference maps for animacy and size for stimuli shown in (A) along the OTC. The limits of the color bar reach full saturation at an absolute value of 0.3 reflecting the beta difference computed from an individual’s GLM. (C) Preference maps for animacy and size on the simulated cortex, for texform and original stimuli. Each unit of the simulated cortex is colored based on their preference for animacy, i.e., animals versus objects and for size, i.e., big versus small objects (purple for animals and green for objects in the animacy map and orange for small objects and blue for big objects). Stimuli and brain maps are adapted from (11).

