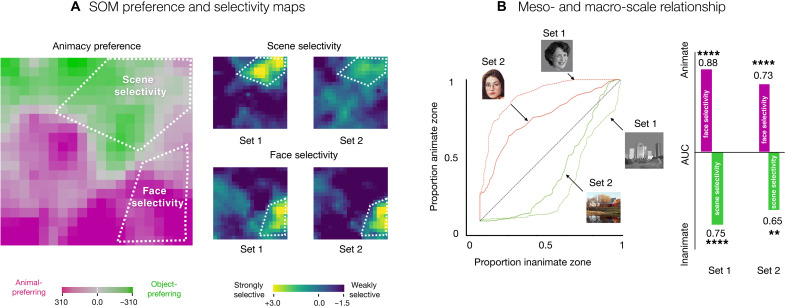
Fig. 5. Relationship between macro- and mesoscale organization.
(A) Preference and selectivity maps. White lines visually demonstrate where the most face-and scene-selective regions fall in reference to the animacy preference zones on the simulated cortex. (B) Area under the curve (AUC) analysis to quantify the category-selective overlap with the preference zones. On the left, we see receiver operating characteristic (ROC) curves for faces and scenes for both stimuli sets. These curves reflect how each of the preference zones fills up as an increasing number of map units on the SOM get included, starting from the most selective. On the right, we compute AUC for the ROC curves. Significance is based on permutation tests: **P < 10−2; ****P < 10−4.

