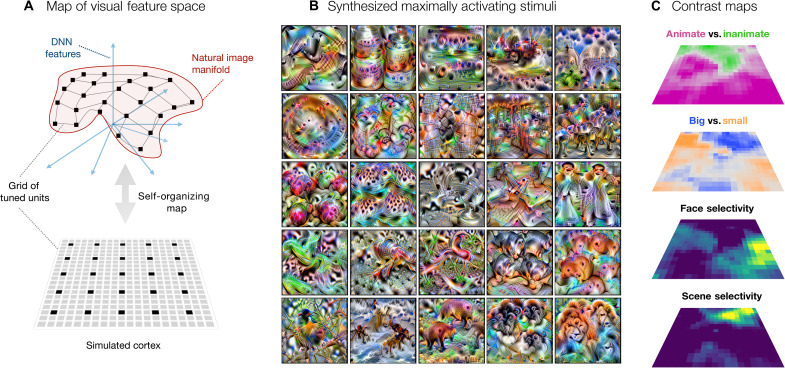
Fig. 7. A map of object space.
(A) Manifold of natural images formed by the images’ DNN features shown in red. The axis demonstrates each of the 4096 dimensions in the relu7 activations of the DNN. The gray connected lines depict the simulated cortex trying to hug this image manifold and the black points depict units on the map/simulated cortex. This simulated cortex can be described via a 2D grid of connected units, i.e., the SOM. (B) Images synthesized using gradient ascent to maximally activate the map units highlighted in (A) via black points. (C) Entire spatial hierarchy learned by the simulated cortex—animacy and size preference and face and scene selectivity.

